Posts Tagged ‘BLACKS’
1984 NOVEL, 9/11, ABC NEWS, ADOLF HITLER, BARACK OBAMA, BILL CLINTON, BIRTH CONTROL, BLACKS, CBS NEWS, CNN, COMMUNISM, DENNIS HASTERT, DISABLED, DISCRIMINATION, DWIGHT D. EISENHOWER, EDWARD R. MURROW, ENVIRONMENTALISTS, FACEBOOK, FAMILY RESEARCH COUNCIL, FRANKLIN D. ROOSEVELT, GAYS, GEORGE C. MARSHALL, GEORGE H.W. BUSH, GEORGE ORWELL, GOP, GREAT SOCIETY, HARRY S. TRUMAN, HISPANICS, HIV MEDICATION, HOUSE OF REPRESENTATIVES, J. ROBERT OPPENHEIMER, JOHN BIRCH SOCIETY, JOHN F. KENNEDY, JOHN STEINBECK, JOSEPH R. MCCARTHY, JOSEPH STALIN, JOSH DUGGAR, KGB, LEE ATWATER, LEON TROTSKY, LESBIANS, LIBERALS, LUCILLE BALL, LYNDON B. JOHNSON, MEDICAL CARE, MEIN KAMPF, MICHAEL DUKAKIS, MICHELLE BACHMANN, MITT ROMNEY, MUSLIMS, NBC NEWS, PETE SEEGER, PROPAGANDA, RELIGION, REPUBLICANS, RICHARD NIXON, RICK SANTORUM, ROBERT WELCH, RODNEY KING RIOTS, SCAPEGOATING, SHARIA LAW, SOCIALISTS, SOVIET UNION, THE LOS ANGELES TIMES, THE NEW YORK TIMES, THE RELIGIOUS FREEDOM RESTORATION ACT, THE WASHINGTON POST, TRANSGENDERS, TWITTER, WILLIAM L. SHIRER, WOMEN, WORLD WAR ii
In Bureaucracy, History, Politics, Social commentary on May 19, 2016 at 12:01 am
The Right’s fixation on transgender “dangers” is only the latest in a long string of “enemies” painted by the Republican party.
During the 1960s and 1970s, the “enemy” was blacks. The key to winning votes of racist whites without appearing racist lay in what Republicans called “the Southern Strategy.”
It was this that won Richard Nixon the Presidency in 1968 and 1972 and the White House for George H.W. Bush in 1988.
In a now-infamous 1981 interview, Right-wing political consultant Lee Atwater explained how this worked:
“You start out in 1954 by saying, ‘Nigger, nigger, nigger.’ By 1968 you can’t say ‘nigger’—that hurts you, backfires.
“So you say stuff like, uh, forced busing, states’ rights, and all that stuff, and you’re getting so abstract.
“Now, you’re talking about cutting taxes, and all these things you’re talking about are totally economic things and a byproduct of them is, blacks get hurt worse than whites.…
“’We want to cut this,’ is much more abstract than even the busing thing, uh, and a hell of a lot more abstract than ‘Nigger, nigger.’
“So anyway you look at it, race is coming on the back burner.”

Lee Atwater
At the end of his life, Atwater recognized the monster he had helped unleash.
Like Reinhard Heydrich–the designer of the “Final Solution” who, on his deathbed, begged forgiveness for his crimes–Atwater, in a 1991 article for Life, apologized to former Democratic Presidential nominee Michael Dukakis for the “naked cruelty” of the 1988 campaign.
But blacks have by no means been the only targets–and victims–of Republican hate campaigns. A partial list of these would include:
- Liberals
- Women
- Socialists
- Secularists
- Disabled
- Environmentalists
- Hispanics
- Gays
- Lesbians
And now transgenders.
George Orwell’s classic 1949 novel, 1984, serves as a better guide to Republican electioneering than any official statement of the GOP.

1984 is set in a futuristic dictatorship called Oceania, whose constantly alternating mortal enemies are Eurasia and Eastasia.
A daily fixture of life in Oceania is the “Two Minutes Hate.” During this, Party members must watch a film depicting the Party’s enemies and express their hatred for them in exactly two minutes.
Chief among these is Emmanuel Goldstein, who is obviously based on Leon Trotsky, the longtime antagonist of Joseph Stalin, dictator of the Soviet Union for almost 30 years.
The “Two Minutes Hate” serves as a form of brainwashing, whose purpose is to whip ordinary citizens into a frenzy of hatred and loathing for whoever the Party designates as its–and their–mortal enemies.
Since the end of World War II, Republicans have regularly hurled the charge of “treason” against anyone who dared to run against them for office or think other than Republican-approved thoughts.
Republicans had been locked out of the White House from 1933 to 1952, during the administrations of Franklin D. Roosevelt and Harry S. Truman.
Determined to regain the Presidency by any means, they found that attacking the integrity of their fellow Americans a highly effective tactic.
During the 1950s, Wisconsin Senator Joseph R. McCarthy rode a wave of paranoia to national prominence–by attacking the patriotism of anyone who disagreed with him.
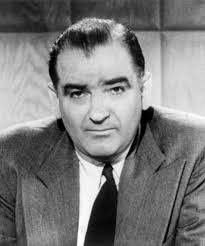
Joseph McCarthy
Elected to the Senate in 1946, he rose to national prominence on February 9, 1950, after giving a fiery speech in Wheeling, West Virginia:
“The State Department is infested with communists. I have here in my hand a list of 205—a list of names that were made known to the Secretary of State as being members of the Communist Party and who nevertheless are still working and shaping policy in the State Department.”
Americans were already growing increasingly fearful of Communism:
- Soviet dictator Joseph Stalin had not withdrawn the Red Army from the countries it had occupied in Eastern Europe during World War II.
- In 1948, the Soviet Union developed–and demonstrated–its own atomic bomb, an achievement U.S. scientists had claimed would not happen for at least a decade.
- In 1949, China fell to the triumphant armies of Mao Tse Tung.
But anti-communism as a lever to political advancement sharply accelerated following McCarthy’s speech. Republicans–resentful at being denied the White House since 1932–seized upon anti-communism as their passport to power.
No American–no matter how prominent–was safe from the accusation of being a Communist or a Communist sympathizer–”a Comsymp” or “fellow traveler” in the style of the era.
Among those accused:
- Secretary of State George C. Marshall, who had overseen America’s strategy for defeating Nazi Germany and Imperial Japan
- President Harry S. Truman
- Playwrights Lillian Hellman and Arthur Miller
- Actors Charlie Chaplin, Zero Mostel, Lloyd Bridges, Howard Da Silva, Edward G. Robinson and John Garfield
- Composers Arron Copland and Elmer Bernstein
- Physicist J. Robert Oppenheimer, who presided over the creation of America’s atomic bomb
- Actresses Lee Grant, Delores del Rio, Ruth Gordon and Lucille Ball
- Journalists Edward R. Murrow and William L. Shirer, who had chronicled the rise of Nazi Germany
- Folksinger Pete Seeger
- Writers Irwin Shaw, Howard Fast, John Steinbeck and Dashiell Hammett
Even “untouchable” Republicans became targets for such slander.
The most prominent of these was President Dwight D. Eisenhower–labeled ”a conscious, dedicated agent of the Communist Conspiracy” by Robert Welch, who founded the John Birch Society in 1958.
ABC NEWS, ALTERNET, AP, BLACKS, BUZZFEED, CBS NEWS, CNN, CROOKS AND LIARS, DAILY KOZ, DAVID BROOKS, DONALD TRUMP, FACEBOOK, HILLARY CLINTON, JOHN KASICH, JOHN MCCAIN, LATINOS, MOTHER JONES, MOVEON, MSNBC, MUSLIMS, NBC NEWS, NEWSWEEK, NICCOLO MACHIAVELLI, NPR, NUCLEAR TRIAD, PBS NEWSHOUR, POLITICO, PRISONERS OF WAR, RAFAEL CRUZ, RAW STORY, REPUBLICAN PRESIDENTIAL NOMINATION, REUTERS, SALON, SEATTLE TIMES, SLATE, THE ATLANTIC, THE CHICAGO SUN-TIMES, THE CHICAGO TRIBUNE, THE DAILY BEAST, THE DISCOURSES, THE GUARDIAN, THE HILL, THE HUFFINGTON POST, THE LOS ANGELES TIMES, THE NATION, THE NEW YORK TIMES, THE PRINCE, THE WASHINGTON POST, TIME, TWITTER, U.S. NEWS & WORLD REPORT, UPI, USA TODAY, WOMEN
In History, Military, Politics, Social commentary on May 10, 2016 at 12:01 am
Donald Trump is riding high, the almost certain Republican nominee for President when that party holds its convention in Cleveland during the week of July 18.
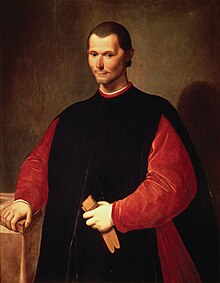
But Niccolo Machiavelli, the 16th-century Florentine statesmen and father of modern politics, has more than a few timely warnings to offer him–and voters inclined to vote for him.
For openers: Trump has drawn heavy criticism for his angry and brutal attacks on a wide range of persons and organizations–including his fellow Republicans, journalists, news organizations, other countries and even celebrities who have nothing to do with politics.
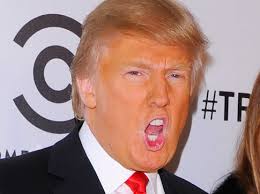
Donald Trump
Now consider Machiavelli’s advice on gratuitously handing out insults and threats:
-
“I hold it to be a proof of great prudence for men to abstain from threats and insulting words towards any one.
-
“For neither the one nor the other in any way diminishes the strength of the enemy–but the one makes him more cautious, and the other increases his hatred of you, and makes him more persevering in his efforts to injure you.”
And Trump’s reaction to the criticism he’s received?
“I can be Presidential, but if I was Presidential I would only have–about 20% of you would be here because it would be boring as hell, I will say,” Trump told supporters at a rally in Superior, Wisconsin.
Trump admitted that his wife, Melania, and daughter, Ivanka, had urged him to be more Presidential. And he promised that he would.
“But I gotta knock off the final two [Republican candidates–Ohio Governor John Kasich and Texas U.S. Senator Rafael Cruz] first, if you don’t mind.”
For those who expect Trump to shed his propensity for constantly picking fights, Machiavelli has a stern warning:
-
“…If it happens that time and circumstances are favorable to one who acts with caution and prudence he will be successful. But if time and circumstances change he will be ruined, because he does not change the mode of his procedure.
-
“No man can be found so prudent as to be able to adopt himself to this, either because he cannot deviate from that to which his nature disposes him, or else because, having always prospered by walking in one path, he cannot persuade himself that it is well to leave it…
-
“For if one could change one’s nature with time and circumstances, fortune would never change.”

Niccolo Machiavelli
Then there is Trump’s approach to consulting advisers:
Asked on MSNBC’s “Morning Joe” who he consults about foreign policy, Trump replied; “I’m speaking with myself, number one, because I have a very good brain and I’ve said a lot of things.”
This totally contrasts the advice given by Machiavelli:
-
“A prudent prince must [choose] for his counsel wise men, and [give] them alone full liberty to speak the truth to him, but only of those things that he asks and of nothing else.
-
“But he must be a great asker about everything and hear their opinions, and afterwards deliberate by himself in his own way, and in these counsels…comport himself so that every one may see that the more freely he speaks, the more he will be acceptable.”
And Machiavelli offers a related warning on the advising of rulers: Unwise princes cannot be wisely advised.
During the fifth GOP debate in the Presidential sweepstakes, host Hugh Hewitt asked Trump this question:
“Mr. Trump, Dr. [Ben] Carson just referenced the single most important job of the president, the command and the care of our nuclear forces. And he mentioned the triad.
“The B-52s are older than I am. The missiles are old. The submarines are aging out. It’s an executive order. It’s a commander-in-chief decision.
“What’s your priority among our nuclear triad?”
[The triad refers to America’s land-, sea- and air-based systems for delivering nuclear missiles and bombs.]

Nuclear missile in silo
Trump’s reply: “Well, first of all, I think we need somebody absolutely that we can trust, who is totally responsible, who really knows what he or she is doing. That is so powerful and so important.”
He then digressed to his having called the Iraq invasion a mistake in 2003 and 2004. Finally he came back on topic:
“But we have to be extremely vigilant and extremely careful when it comes to nuclear.
“Nuclear changes the whole ballgame. The biggest problem we have today is nuclear–nuclear proliferation and having some maniac, having some madman go out and get a nuclear weapon.
“I think to me, nuclear, is just the power, the devastation is very important to me.”
Which brings us back to Machiavelli:
-
“…Some think that a prince who gains the reputation of being prudent [owes this to] the good counselors he has about him; they are undoubtedly deceived.
-
“It is an infallible rule that a prince who is not wise himself cannot be well advised, unless by chance he leaves himself entirely in the hands of one man who rules him in everything, and happens to be a very prudent man. In this case, he may doubtless be well governed, but it would not last long, for the governor would in a short time deprive him of the state.”
All of which would lead Niccolo Machiavelli to warn, if he could witness American politics today: “This bodes ill for your Republic.”
ABC NEWS, ALTERNET, AP, ASIANS, BLACKS, BUZZFEED, CBS NEWS, CNN, CROOKS AND LIARS, DAILY KOZ, DAVID BROOKS, DONALD TRUMP, FACEBOOK, HILLARY CLINTON, JOHN KASICH, JOHN MCCAIN, LATINOS, MOTHER JONES, MOVEON, MSNBC, MUSLIMS, NBC NEWS, NEWSWEEK, NICCOLO MACHIAVELLI, NPR, NUCLEAR TRIAD, PBS NEWSHOUR, POLITICO, PRISONERS OF WAR, RAFAEL CRUZ, RAW STORY, REPUBLICAN PRESIDENTIAL NOMINATION, REUTERS, SALON, SEATTLE TIMES, SLATE, THE ATLANTIC, THE CHICAGO SUN-TIMES, THE CHICAGO TRIBUNE, THE DAILY BEAST, THE DISCOURSES, THE GUARDIAN, THE HILL, THE HUFFINGTON POST, THE LOS ANGELES TIMES, THE NATION, THE NEW YORK TIMES, THE PRINCE, THE WASHINGTON POST, TIME, TWITTER, U.S. NEWS & WORLD REPORT, UPI, USA TODAY, USA TODAY DONALD TRUMP, WOMEN
In History, Military, Politics, Social commentary on May 9, 2016 at 12:37 am
Donald Trump has swept the field of his political rivals. The Republican nomination for President now stands within his reach.
The “Anybody-But-Trump” coalition no longer has a champion. Its last two–Ohio Governor John Kasich and Texas U.S. Senator Rafael Cruz–have bowed out of the race.
On May 3, Trump captured 53.3% of the votes in the Indiana primary, compared to 36.7% for Cruz and 7.5% for Kasich.
That night, Cruz threw in the towel.
“Together we left it all on the field in Indiana,” Cruz told his disappointed supporters in Indianapolis. “We gave it everything we’ve got. But the voters chose another path.”
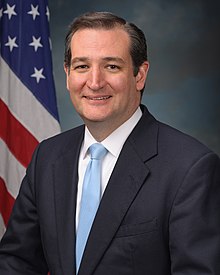
Rafael “Ted” Cruz
The next day–May 4–so did Kasich, the only candidate who had dared compare Trump to Adolf Hitler.
All that Trump need do, from here on, is wait until the Republican convention assembles in Cleveland during the week of July 18.
Even so, Trump gets poor marks as a man and a candidate from many of his fellow conservatives.
One of these is New York Times political columnist David Brooks.

David Brooks
Appearing on the May 25 edition of The PBS Newshour, Brooks offered some highly disturbing assessments about the man who seeks to control the most powerful nation in the world.
- “The odd thing about [Trump’s] whole career and his whole language, his whole world view is there is no room for love in it. You get a sense of a man who has received no love, can give no love, so his relationship with women, it has no love in it. It’s trophy.”
- “And [Trump’s] relationship toward the world is one of competition and beating, and as if he’s going to win by competition what other people get by love.”
- “And so you really are seeing someone who just has an odd psychology unleavened by kindness and charity, but where it’s all winners and losers, beating and being beat. And that’s part of the authoritarian personality….”
An even more damning assessment comes from Niccolo Machiavelli, the 16th-century Florentine statesman whose two great works on politics–The Prince and The Discourses–remain textbooks for successful politicians more than 500 years later.
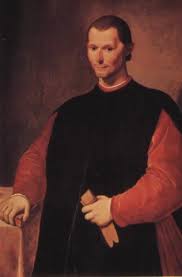
Niccolo Machiavelli
Consider Trump’s notoriety for hurling insults at virtually everyone, including:
- Latinos
- Asians
- Muslims
- Blacks
- The Disabled
- Women
- Prisoners-of-War
These insults delight his white, under-educated followers. But they have alienated millions of other Americans who might have voted for him.
Among those groups–and the insults Trump has leveled at them:
- Mexicans: “They’re bringing drugs. They’re bringing crime. They’re rapists.” He’s also promised to “build a great, great wall on our southern border and I will have Mexico pay for that wall.”
- Prisoners-of-War: Speaking of Arizona U.S. Senator John McCain, a Vietnam POW for seven years: “He’s not a war hero. He’s a war hero because he was captured. I like people that weren’t captured.”
- Blacks: At a Trump rally in Birmingham, Alabama, he was interrupted by black activist Mercutio Southall, who repeatedly shouted: “Black lives matter!” Trump ordered his removal, and several of his supporters beat and kicked Southall. Later, Trump said: “Maybe he should have been roughed up, because it was absolutely disgusting what he was doing.”
- Trump retweeted an image of a masked, dark-skinned man with a handgun and a series of alleged crime statistics, including: “Blacks killed by whites – 2%”; “Whites killed by blacks – 81%.” The image cites the “Crime Statistics Bureau – San Francisco”–an agency that doesn’t exist.
- Muslims: Trump has boasted he would require Muslims to register with the Federal Government. And he would close “some mosques” if he felt they were being used by Islamic terrorists.
- Women: “If Hillary Clinton can’t satisfy her husband, what makes her think she can satisfy America?”
- “Twenty-six thousand unreported sexual assaults in the military–only 238 convictions. What did these geniuses expect when they put men and women together?”
- Asians: “Negotiating with Japan, negotiating with China, when these people walk into the room, they don’t say, ‘Oh hello, how’s the weather? So beautiful outside, isn’t it lovely? How are the Yankees doing? Oh, they are doing wonderful, great.’ They say, ‘We want deal!’”
Machiavelli, on the other hand, advises leaders to refrain from gratuitous insults:
- “It is not necessary for a prince to have all the above-named qualities [mercy, faith, humanity, integrity and religion] but it is very necessary to seem to have them….”
- “A prince must take care that nothing goes out of his mouth which is not full of the above-named five qualities, and he should seem to be all mercy, faith, integrity, humanity and religion.”
- “And nothing is more necessary than to seem to have this last quality, for men in general judge more by the eyes than by the hands, for every one can see, but very few have to feel. Everyone seems what you appear to be, few feel what you are….”
- “…[The Roman Emperor Commodus]…by not maintaining his dignity, by often descending into the theater to fight with gladiators and committing other contemptible actions…became despicable in the eyes of the soldiers. And being hated on the one hand and despised on the other, he was conspired against and killed.”
2000 PRESIDENTIAL RACE, 2012 PRESIDENTIAL RACE, 2016 PRESIDENTIAL RACE, ABC NEWS, AL GORE, BARACK OBAMA, BLACKS, CBS NEWS, CHRIS CHRISTIE, CNN, DONALD TRUMP, ELECTORAL COLLEGE, FACEBOOK, GEORGE ORWELL, GEORGE W. BUSH, MARCO RUBIO, MEXICANS, MITT ROMNEY, MUSLIMS, NBC NEWS, NINETEEN-EIGHTY-0FOUR, POW'S, RAFAEL CRUZ, REPUBLICAN PARTY, THE CHICAGO SUN-TIMES, THE CHICAGO TRIBUNE, THE LOS ANGELES TIMES, THE NEW YORK TIMES, THE WASHINGTON POST, TWITTER
In Bureaucracy, Business, History, Politics, Social commentary on March 8, 2016 at 12:17 am
During the 2012 Presidential campaign, Donald Trump endorsed Mitt Romney as the Republican nominee to defeat President Barack Obama.
But that was before Trump decided to run for President in 2016. And the relationship between Trump and Romney has taken a considerably different turn.
On June 16, 2015, Trump declared his candidacy for the 2016 Republican Presidential nomination. Since then, he has been the first choice among the Republican base.
At first, he was dismissed as a bad joke–by Republican Presidential candidates as well as Democrats. Surely voters would reject a bombastic, thrice-married “reality show” host who had filed for corporate bankruptcy four times.
Yet from the outset Trump dominated the field–and a series of Republican debates. The other Republican candidates watched him with envy–and desperately tried to steal some of his limelight.
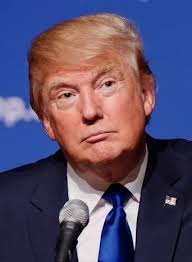
Donald Trump
Making one inflammatory statement after another, he offended one group of potential voters after another. These insults delighted his white, under-educated followers. But they alienated millions of other Americans who might have voted for him.
Among these:
- Mexicans: “They’re bringing drugs. They’re bringing crime. They’re rapists.” He’s also promised to “build a great, great wall on our southern border and I will have Mexico pay for that wall.”
- Blacks: Trump retweeted an image of a masked, dark-skinned man with a handgun and a series of alleged crime statistics, including: “Blacks killed by whites – 2%”; “Whites killed by blacks – 81%.” The image cites the “Crime Statistics Bureau – San Francisco”–an agency that doesn’t exist.
- Illegal Aliens: Trump has threatened to forcibly deport millions of mostly Mexican and Central American residents.
- Muslims: Trump has boasted he would ban them from entering the United States–and revive waterboarding of terrorist suspects. He would require Muslims to register with the Federal Government. And he would close “some mosques” if he felt they were being used by Islamic terrorists.
- POWs: Speaking of Arizona U.S. Senator John McCain: “He’s a war hero because he was captured. I like people who weren’t captured.” [Trump avoided military service–and Vietnam]
Many Republican members of Congress share–privately–Trump’s views on Hispanics, blacks and Muslims. But they realize that giving voice to such opinions can be politically suicidal.
Increasingly, the Republican party has become the bastion of aging white males. Even former President George W. Bush worked to win over Hispanics as Republican voters.
But the party’s increasingly strident anti-immigration rhetoric has alienated millions of Hispanics. And its open contempt for the nation’s first black President drove millions of blacks to the polls, where they handed Obama the White House–first in 2008, and again in 2012.
As a result, many Republicans now fear that Trump will gain their party’s Presidential nomination–and then lose in November, most likely to Hillary Clinton.
Even worse from their perspective: He might cost Republicans–who now dominate the House of Representatives and the Senate–one or both legislative bodies.
So many Republicans are now desperately trying to deny Trump the nomination. And one of these is Mitt Romney–the man Trump endorsed in 2012 as the best candidate to remove Obama from the White House.
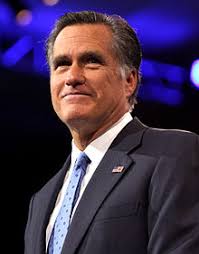
Mitt Romney
On March 3, in a speech at the University of Utah, Romney outlined why a Trump Presidency would be a disaster for the nation (not to mention the Republicans).
Among his comments:
“If we Republicans choose Donald Trump as our nominee, the prospects for a safe and prosperous future are greatly diminished….
“If Donald Trump’s plans were ever implemented, the country would sink into prolonged recession….
“Donald Trump is a phony, a fraud. His promises are as worthless as a degree from Trump University….
“But you say, wait, wait, wait, isn’t he a huge business success? Doesn’t he know what he’s talking about? No, he isn’t and no he doesn’t.
“Look, his bankruptcies have crushed small businesses and the men and women who work for them. He inherited his business, he didn’t create it.
“And whatever happened to Trump Airlines? How about Trump University? And then there’s Trump Magazine and Trump Vodka and Trump Steaks and Trump Mortgage. A business genius he is not….
“Now let me turn to national security and the safety of our homes and loved ones. Mr. Trump’s bombast is already alarming the allies and fueling the enmity of our enemies.
“Insulting all Muslims will keep many of them from fully engaging with us in the urgent fight against ISIS, and for what purpose? Muslim terrorists would only have to lie about their religion to enter the country….
“Now, I’m far from the first to conclude that Donald Trump lacks the temperament to be president.
“After all, this is an individual who mocked a disabled reporter, who attributed a reporter’s questions to her menstrual cycle, who mocked a brilliant rival who happened to be a woman due to her appearance, who bragged about his marital affairs, and who laces his public speeches with vulgarity.
“Donald Trump says he admires Vladimir Putin, at the same time he has called George W. Bush a liar. That is a twisted example of evil trumping good.”
Thus Mitt Romney on the man who once endorsed him for President. In the next column, we’ll see what Trump thinks of the man he once endorsed for President.
2000 PRESIDENTIAL RACE, 2012 PRESIDENTIAL ELECTION, 2016 PRESIDENTIAL RACE, ABC NEWS, AL GORE, BARACK OBAMA, BLACKS, CBS NEWS, CHRIS CHRISTIE, CNN, DONALD TRUMP, ELECTORAL COLLEGE, FACEBOOK, GEORGE ORWELL, GEORGE W. BUSH, MARCO RUBIO, MEXICANS, MITT ROMNEY, MUSLIMS, NBC NEWS, NINETEEN-EIGHTY-FOUR, POW'S, RAFAEL CRUZ, REPUBLICAN PARTY, THE CHICAGO SUN-TIMES, THE CHICAGO TRIBUNE, THE LOS ANGELES TIMES, THE NEW YORK TIMES, THE WASHINGTON POST, TWITTER
In Bureaucracy, Business, History, Politics, Social commentary on March 7, 2016 at 12:23 am
In 2011, Donald Trump, the egocentric businessman and “reality star” of NBC’s “The Apprentice,” was toying with the idea of running for President in 2012.
On April 17, 2011, Trump said this about Mitt Romney, a possible rival and the former Massachusetts governor and front-runner GOP candidate:
“He’d buy companies, he’d close companies. He’d get rid of jobs. I’ve built a great company. I’m a much bigger businessman and have a much, much bigger net worth. I mean, my net worth is many, many, many times Mitt Romney.
“Mitt Romney is a basically small-business guy, if you really think about it. He was a hedge fund. He was a funds guy. He walked away with some money from a very good company that he didn’t create. He worked there. He didn’t create it.”

Donald Trump
Trump added that Bain Capital, the hedge fund where Romney made millions of dollars before running for governor, didn’t create any jobs. Whereas Trump claimed that he–Trump–had created “hundreds of thousands of jobs.”
So at least some observers must have been puzzled when Trump announced, on February 2, 2012: “It’s my honor, real honor and privilege, to endorse Mitt Romney” for President.
“Mitt is tough. He’s smart. He’s sharp. He’s not going to allow bad things to continue to happen to this country that we all love. So, Governor Romney, go out and get ’em. You can do it,” said Trump.
And Romney, in turn, had his own swooning-girl moment:
“I’m so honored to have his endorsement. There are some things that you just can’t imagine in your life. This is one of them.”

Mitt Romney
Throughout the 2012 Presidential race, Trump continued to “help” Romney–by repeatedly accusing President Barack Obama of not being an American citizen.
Had that been true, Obama would not have had the right to be President–since the Constitution says that only an American citizen can hold this position.
Of course, that was entirely what Trump wanted people to believe– that Obama was an illegitimate President, and deserved to be thrown out.
Come election night–and disaster for Romney–and Trump.
When it became clear that Romney was not going to be America’s 45th President, Trump went ballistic on Twitter.
Among his tweets:
- More votes equals a loss…revolution!
- Lets fight like hell and stop this great and disgusting injustice! The world is laughing at us.
- We can’t let this happen. We should march on Washington and stop this travesty. Our nation is totally divided!
- The phoney electoral college made a laughing stock out of our nation. The loser one!
- He lost the popular vote by a lot and won the election. We should have a revolution in this country!
To put Trump’s rants into real-world perspective:
According to Trump, the electoral process works when a Republican wins the Presidency. It only doesn’t work when a Democrat wins.
“We should march on Washington” conjures up images of another Fascist–Benito Mussolini–marching on Rome at the head of his Blackshirts to seize power.
“The phoney electoral college made a laughing stock out of our nation. The loser one!”
This is startling, on three counts:
First, the 2012 Republican Platform spoke lovingly about the need for preserving the Electoral College: “We oppose the National Popular Vote Interstate Compact or any other scheme to abolish or distort the procedures of the Electoral College.
“We recognize that an unconstitutional effort to impose ‘national popular vote’ would be a mortal threat to our federal system and a guarantee of corruption as every ballot box in every state would become a chance to steal the presidency.”
Second, the loser didn’t win: He lost. With votes still being counted (as of November 8) Obama got 60,652,238. Romney got 57,810,407.
Third, in 2000, Al Gore won the popular vote (50,999,897) to George W. Bush’s 50,456,002. But Bush trounced Gore in the Electoral College (271 to 266).
Still, that meant Bush–not Gore–would head the country for the next eight years. And that was perfectly OK with Right-wingers like Trump.
It was only when Obama won the Electoral College count by 332 to 206 that this was–according to Trump–a “travesty.”
And Trump’s solution if voters dare to elect someone other than Trump’s pet choice: “Revolution!”
This comes perilously close to advocating violent overthrow of the government. Otherwise known as treason–a crime traditionally punished by execution, or at least lengthy imprisonment.

Fast forward, to 2016–and the relationship between Trump and Romney looks considerably different.
On June 16, 2015, Trump declared his candidacy for the 2016 Republican Presidential nomination. Since then, he has been the first choice among the Republican base.
At first, he was dismissed as a bad joke–by Republican Presidential candidates as well as Democrats. Surely voters would reject a bombastic, thrice-married “reality show” host who had filed for corporate bankruptcy four times.
Yet from the outset Trump dominated the field–and a series of Republican debates. The other Republican candidates watched him with envy–and desperately tried to steal some of his limelight.
Making made one inflammatory statement after another, he offended one group of potential voters after another.
These insults delighted his white, under-educated followers. But they alienated millions of other Americans who might have voted for him.
2016 PRESIDENTIAL RACE, ABC NEWS, ADOLF HITLER, ALTERNET, AMERICABLOG, AP, BABY BOOMER RESISTANCE, BBC, BLACKS, BLOOMBERG NEWS, BUZZFEED, CBS NEWS, CLAUS VON STAUFFENBERG, CNN, CROOKS AND LIARS, DAILY KOS, DONALD TRUMP, FACEBOOK, FIVETHIRTYEIGHT, GEORGE C. WALLACE, HARPER’S MAGAZINE, HUEY LONG, HUFFINGTON POST, ILLEGAL ALIENS, JOHN KASICH, LATINOS, MARTIN NIEMOELLER, MEDIA MATTERS, MOTHER JONES, MOVEON, MSNBC, MUSLIMS, NAZI GERMANY, NBC NEWS, NEW REPUBLIC, NEWSDAY, NEWSWEEK, NPR, PBS NEWSHOUR, POLITICO, POLITICUSUSA, RAW STORY, REUTERS, ROBERT PAYNE, Ronald Reagan, SALON, SEATTLE TIMES, SLATE, SS, TALKING POINTS MEMO, THE ATLANTIC, THE CHICAGO SUN-TIMES, THE CHICAGO TRIBUNE, THE DAILY BEAST, THE DAILY BLOG, THE GUARDIAN, THE HILL, THE HUFFINGTON POST, THE INTERCEPT, THE LIFE AND DEATH OF ADOLF HITLER, THE LOS ANGELES TIMES, THE NATION, THE NEW REPUBLIC, THE NEW YORK TIMES, THE NEW YORKER, THE VILLAGE VOICE, THE WASHINGTON POST, THINKPROGRESS, TIME, TRUTHDIG, TRUTHOUT, TWILIGHT ZONE, TWITTER, U.S. NEWS & WORLD REPORT, UPI, WORLD WAR 11
In Bureaucracy, History, Military, Politics, Social commentary on March 2, 2016 at 12:02 am
On July 20, 1944, Colonel Claus Schenk von Stuaffenberg failed to assassinate Adolf Hitler with a bomb hidden in a briefcase.
He had carefully placed his briefcase near Hitler, who was standing next to a heavy oaken support of the conference table.
But after Stauffenberg left the room, Colonel Heinz Brandt, who stood next to Hitler, found the briefcase blocking his legs.
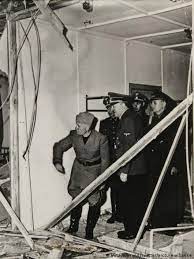
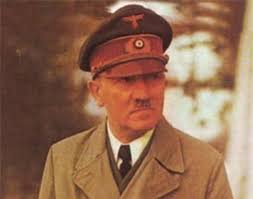
Hitler shows off the site of the explosion
So he moved it–to the other side of the heavy oaken support. When the bomb exploded, Hitler was partially shielded from its full blast. Brandt died, as did two other officers and a stenographer.
Not only did Hitler survive, but the plotters failed to seize the key broadcast facilities of the Reich.
This allowed Hitler to make a late-night speech to the nation, revealing the failed plot and assuring Germans that he was alive. And he swore to flush out the “traitorous swine” who had tried to kill him.
Among the first victims was the conspiracy’s leader, Colonel Claus von Stauffenberg. Standing before a makeshift firing squad at midnight, he cried: “Long live our sacred Germany!”
At least 7,000 persons were arrested by the Gestapo. According to records of the Fuehrer Conferences on Naval Affairs, 4,980 were executed.
If the conspiracy had succeeded and Germany had surrendered in July or August, 1944, World War II would have ended eight to nine months earlier. This would have meant:
- The Russians–who didn’t reach Germany until April, 1945–could not have occupied the Eastern part of the country.
- Millions of East Germans would have been spared the misery of living under Communist rule for 44 years.
- Many of the future conflicts between the United States and the Soviet Union over access to West Berlin and/or West Germany would have been prevented.
- Untold numbers of Holocaust victims would have survived because the concentration camps would have been shut down far earlier.
Thus, history can be altered by the appearance–or disappearance–of a single individual.
Which brings us back to Donald Trump.
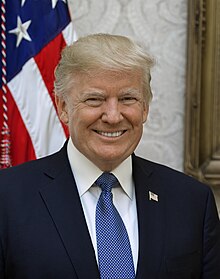
Donald Trump
Since declaring his candidacy for the Presidency on June 16, 2015, Trump has been the first choice among the Republican base.
At first, he was dismissed as a bad joke–by Republican Presidential candidates as well as Democrats. Surely voters would reject an egotistical, thrice-married, “reality show” host who had filed for corporate bankruptcy four times.
Yet from the outset Trump dominated the field–and a series of Republican debates. His fellow Republican candidates enviously watched him–and desperately tried to steal some of his limelight.
Making made one inflammatory statement after another, he offended one group of potential voters after another:
- Mexicans: “They’re bringing drugs. They’re bringing crime. They’re rapists.” He’s also promised to “build a great, great wall on our southern border and I will have Mexico pay for that wall.”
- Blacks: Trump retweeted an image of a masked, dark-skinned man with a handgun and a series of alleged crime statistics, including: “Blacks killed by whites – 2%”; “Whites killed by blacks – 81%.” The image cites the “Crime Statistics Bureau – San Francisco”–an agency that doesn’t exist.
- Illegal Aliens: Trump has threatened to forcibly deport millions of mostly Mexican and Central American residents.
- Muslims: Trump has boasted he would ban them from entering the United States–and revive waterboarding of terrorist suspects. He would require Muslims to register with the Federal Government. And he would close “some mosques” if he felt they were being used by Islamic terrorists.
- POWs: Speaking of Arizona U.S. Senator John McCain: “He’s a war hero because he was captured. I like people who weren’t captured.”
Niccolo Machiavelli, the father of modern politics, warned against hurling threats and insults: “For neither the one nor the other diminishes the strength of the enemy.
 Niccolo Machiavelli
“[Threats make] him more cautious, and [insults increase] his hatred of you, and [make] him more persevering in his efforts to injure you.”
But Trump revels in insulting anyone who dares to challenge him. He gleefully warns of the damage he will soon inflict on those who dare to oppose–or even criticize–him.
At the same time, he publicly exposes himself to a potential assassin virtually every day. And the mere presence of bodyguards is no guarantee against assassination.
Presidential candidate George C. Wallace was shot and paralyzed by a gunman while mingling with supporters in a Maryland shopping center in 1972. And President Ronald Reagan was shot and almost killed in 1981 while walking to his bulletproof limousine in Washington, D.C.
Both men were under protection by the U.S. Secret Service at the time.
* * * * *
In his bestselling 1973 biography, The Life and Death of Adolf Hitler, British historian Robert Payne harshly condemned the German people for the rise of the Nazi dictator:
“[They] allowed themselves to be seduced by him and came to enjoy the experience….[They] followed him with joy and enthusiasm because he gave them license to pillage and murder to their hearts’ content.”
There is a very real danger that millions of ignorant, hate-filled, Right-wing Americans will catapult Donald Trump–a man with an “odd psychology unleavened by kindness and charity”–into the Presidency.
And that this man–“who received no love, can give no love”–will assume all the awesome power that goes with that office.
If that happens, future historians–if there are any–may similarly condemn those Americans who stood by like “good Germans” and allowed their country to fall into the hands of a ruthless tyrant.
ABC NEWS, ADOLF HITLER, ALTERNET, AMERICABLOG, AP, BABY BOOMER RESISTANCE, BBC, BLACKS, BLOOMBERG NEWS, BUZZFEED, CBS NEWS, CLAUS VON STAUFFENBERG, CNN, CROOKS AND LIARS, DAILY KOS, DONALD TRUMP, FACEBOOK, FIVETHIRTYEIGHT, GEORGE C. WALLACE, HARPER’S MAGAZINE, HUEY LONG, HUFFINGTON POST, ILLEGAL ALILENS, JOHN KASICH, LATINOS, MARTIN NIEMOELLER, MEDIA MATTERS, MOTHER JONES, MOVEON, MSNBC, MUSLIMS, NAZI GERMANY, NBC NEWS, NEW REPUBLIC, NEWSDAY, NEWSWEEK, NPR, PBS NEWSHOUR, POLITICO, POLITICUSUSA, RAW STORY, REUTERS, ROBERT PAYNE, Ronald Reagan, SALON, SEATTLE TIMES, SLATE, SS, TALKING POINTS MEMO, THE ATLANTIC, THE CHICAGO SUN-TIMES, THE CHICAGO TRIBUNE, THE DAILY BEAST, THE DAILY BLOG, THE GUARDIAN, THE HILL, THE HUFFINGTON POST, THE INTERCEPT, THE LIFE AND DEATH OF ADOLF HITLER, THE LOS ANGELES TIMES, THE NATION, THE NEW REPUBLIC, THE NEW YORK TIMES, THE NEW YORKER, THE VILLAGE VOICE, THE WASHINGTON POST, THINKPROGRESS, TIME, TRUTHDIG, TRUTHOUT, TWILIGHT ZONE, TWITTER, U.S. NEWS & WORLD REPORT, UPI, WORLD WAR ii
In Bureaucracy, History, Military, Politics, Social commentary on March 1, 2016 at 12:15 am
On July 20, 1944, Colonel Claus Schenk von Stuaffenberg tried to assassinate Adolf Hitler.
He had served with the Wehrmacht in Poland (1939), France (1940) and the Soviet Union (1941).
While serving in Tunisa, he was seriously wounded on April 7, 1943, when Allied fighters strafed his vehicle. He lost his left eye, right hand and two fingers of his left hand after surgery.

Colonel Claus Schenk von Stuaffenberg
Nevertheless, he now acted as the prime mover for the conspiracy among a growing number of German high command officers to arrest or assassinate Germany’s Fuehrer.
For most of these officers, the motive was craven: The “happy time’ of German victories was over. Germany was losing the war it had launched on the world in 1939–and now they feared the worst.
This was especially true now that the numerically superior forces of the Soviet Union had gone onto the offensive.
For Stauffenberg, there was another reason: His disgust at the horrors he had seen committed by his fellow Wehrmacht soldiers upon defenseless POW’s and civilians in Russia.
Thus, Stauffenberg–more than many Germans–knew firsthand the vengeance his country could expect if the “Thousand-Year Reich” fell.
Something must be done, he believed, to prove to the world that not all Germans–even members of the Wehrmacht–were criminals.
Most of the conspirators wanted to arrest Hitler and surrender to British and American forces–well before the much-feared Russians gained a toehold in Germany.
Stauffenberg didn’t want to arrest Hitler; he wanted to kill him. A live Hitler might eventually be rescued by his Nazi colleagues.
But Hitler was a closely-guarded target. He was surrounded by fanatical bodyguards who were expert marksmen. He often wore a bulletproof vest and a cap lined with three pounds of laminated steel.
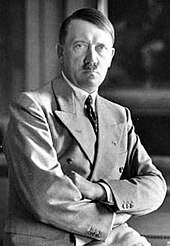
Adolf Hitler
Bundesarchiv, Bild 146-1990-048-29A / CC-BY-SA 3.0 [CC BY-SA 3.0 de (https://creativecommons.org/licenses/by-sa/3.0/de/deed.en)%5D
But his single greatest protection–he claimed–was an instinct for danger. He would suddenly change his schedule–to drop in where he was least expected. Or suddenly depart an event where he was expected to stay a long time.
On November 9, 1939, this instinct saved his life.
He had been set to give a long speech at a Munich beer hall before the “Old Fighters” of his storm troopers.
Sixteen years earlier on that day, in 1923, Hitler had led them in a disastrous attempt to overthrow the Bavarian government. Police had put down the effort, killing and wounding about a score of storm troopers in the process.
Hitler himself had later been arrested, tried and convicted for treason–and sentenced to a year’s imprisonment.
But instead of proving to be the end of Nazism, the “Beer Hall Putsch” turned Hitler into a national celebrity. And it launched his career as a legitimate, ultimately successful politician.
So Hitler was expected to speak to his longtime supporters for a long time that evening. Instead, he suddenly cut short his speech and left the beer hall. Forty-five minutes later, a bomb exploded inside a pillar–before which Hitler had been speaking.
Since then, a series of other assassination attempts had been made against Hitler. All of them involved time-bombs. And all of the would-be assassins were members of the German General Staff.
In one case, a bomb secretly stashed aboard Hitler’s plane failed to explode. In another, an officer who had a bomb strapped to himself unexpectedly found his scheduled meeting with Hitler called off. He had to rush into a bathroom to defuse the bomb before it went off.
So now it was the turn of von Stauffenberg. He would carry his bomb–hidden in a briefcase–into a “Hitler conference” packed with military officers.
But Stauffenberg didn’t intend to be a suicide bomber. He meant to direct the government that would replace that of the Nazis.
His bomb–also rigged with a time-fuse–would be left in the conference room while he found an excuse to leave. After the explosion, he would phone one of his fellow conspirators with the news.
Then, the coup–“Operation Valkyrie”–would be on.
Anti-Nazi conspirators would seize control of key posts of the government. The British and Americans would then be informed of Germany’s willingness to surrender. Provided, of course, that the vengeance-seeking Russians did not have a say in its postwar future.
The Wehrmacht and Schutzstaffel (SS) had killed millions of Russians. Many had died in combat. Others had been murdered as captives. Still more had been allowed to die by starvation and exposure to the notorious Russian winter.
So the Germans–both Nazi and anti-Nazi–knew what they could expect if soldiers of the Soviet Union reached German soil.
On July 20, 1944, Stauffenberg appeared at Hitler’s well-guarded military headquarters in East Prussia. Like all his other outposts, Hitler had named it–appropriately enough–“Wolf’s Lair.”

“Wolf’s Lair”
Stauffenberg entered the large, concrete building while the conference was in session. He placed his yellow briefcase next to Hitler–who was standing with his generals at a heavy oaken table. Then he excused himself to take an “urgent” phone call.
At 12:42 p.m. on July 20, 1944, Stauffenberg’s briefcase bomb erupted.
But, as if by a miracle, Hitler–and the Third Reich–survived.
2016 PRESIDENTIAL RACE, ABC NEWS, ADOLF HITLER, ALTERNET, AMERICABLOG, AP, BABY BOOMER RESISTANCE, BBC, BLACKS, BLOOMBERG NEWS, BUZZFEED, CBS NEWS, CLAUS VON STAUFFENBERG, CNN, CROOKS AND LIARS, DAILY KOS, DONALD TRUMP, FACEBOOK, FIVETHIRTYEIGHT, GEORGE C. WALLACE, HARPER’S MAGAZINE, HUEY LONG, HUFFINGTON POST, ILLEGAL ALIENS, JOHN KASICH, LATINOS, MARTIN NIEMOELLER, MEDIA MATTERS, MOTHER JONES, MOVEON, MSNBC, MUSLIMS, NAZI GERMANY, NBC NEWS, NEW REPUBLIC, NEWSDAY, NEWSWEEK, NPR, PBS NEWSHOUR, POLITICO, POLITICUSUSA, RAW STORY, REUTERS, ROBERT PAYNE, Ronald Reagan, SALON, SEATTLE TIMES, SLATE, SS, TALKING POINTS MEMO, THE ATLANTIC, THE CHICAGO SUN-TIMES, THE CHICAGO TRIBUNE, THE DAILY BEAST, THE DAILY BLOG, THE GUARDIAN, THE HILL, THE HUFFINGTON POST, THE INTERCEPT, THE LIFE AND DEATH OF ADOLF HITLER, THE LOS ANGELES TIMES, THE NATION, THE NEW REPUBLIC, THE NEW YORK TIMES, THE NEW YORKER, THE VILLAGE VOICE, THE WASHINGTON POST, THINKPROGRESS, TIME, TRUTHDIG, TRUTHOUT, TWILIGHT ZONE, TWITTER, U.S. NEWS & WORLD REPORT, UPI, WORLD WAR ii
In Bureaucracy, History, Military, Politics, Social commentary on February 29, 2016 at 10:31 am
“When Fascism comes to America, it will be called anti-Fascism.”
–Huey Long, Louisiana Governor/Senator
In the “Twilight Zone” episode, “No Time Like the Past,” Paul Driscoll (Dana Andrews), a scientist in early 1960s America, uses a time machine to visit Nazi Germany on the eve of World War II.
He’s rented a motel room overlooking the balcony from where the Fuehrer, Adolf Hitler will soon make a speech. And he’s eager to watch that speech–through the lens of a telescopic-sighted rifle.
Just as he’s about to pull the trigger, there’s a knock at his door–by the maid. Driscoll hustles her out as soon as possible, then once again picks up his rifle. He–and viewers–can once again see Hitler through the cross-hairs of his weapon.

Paul Driscoll prepares to shoot Adolf Hitler
But instead of the anticipated shot, there’s another knock at his door–this time by the black-uniformed secret police, the SS. Driscoll knows the game is over, and disappears into the present just as the thugs break down his door.
And the audience is left to ponder how different the world would have been if Driscoll–or someone in Nazi Germany–had succeeded in assassinating the man whose wars would wipe out the lives of 50 million men, women and children around the globe.
At least one Republican candidate for President has dared to invoke the past of Nazi Germany in warning of the dangers of a Donald Trump Presidency. And to argue that Americans have a chance to prevent that past from returning.
In November, 2015, John Kasich, the governor of Ohio, was peddling a message of creating jobs, balancing the Federal budget and disdain for Washington, D.C.
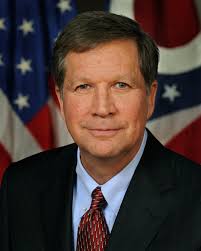
John Kasich
But he remained far behind in the polls, dropping 50% in support in just one month–from September to October. Meanwhile, Trump, the New York billionaire developer, was being backed by 25% of Republican primary voters.
So, with nothing to lose, Kasich decided to take off the gloves. He invoked the “N” word for Republicans: Nazi.
He authorized the creation of a TV ad that opened with ominous music–and the face of a snarling Donald Trump.
“I would like anyone who is listening to consider some thoughts that I’ve paraphrased from the words of German pastor Martin Niemoeller.”
The voice belonged to Tom Moe, a retired colonel in the U.S. Air Force–and a former Vietnam prisoner-of-war.
“You might not care if Donald Trump says Muslims must register with the government, because you’re not one,” continued Moe.
“And you might not care if Donald Trump says he’s going to round up all the Hispanic immigrants, because you’re not one.
Donald Trump
“And you might not care if Donald Trump says it’s OK to rough up black protesters, because you’re not one.
“And you might not care of Donald Trump wants to suppress journalists, because you’re not one.
“But think about this:
“If he keeps going, and he actually becomes President, he might just get around to you. And you’d better hope that there’s someone left to help you.”
Martin Niemoeller (1892–1984) was a prominent Protestant pastor who had commanded a U-boat during World War 1. He became a bitter public foe of Adolf Hitler.
A staunch anti-Communist, he had initially supported the Nazis as Germany’s only hope of salvation against the Soviet Union.
But when the Nazis made the church subordinate to State authority, Niemoeller created the Pastors’ Emergency League to defend religious freedom.
For his opposition to the Third Reich, Niemoeller spent seven years in concentration camps.
With the collapse of the Reich in 1945, he was freed–and elected President of the Protestant church in Hesse and Nassau in 1947. During the 1960s, he was a president of the World Council of Churches.
He is best remembered for his powerful condemnation of the failure of Germans to protest the increasing oppression of the Nazis:
First they came for the Communists, but I was not a Communist, so I did not speak out.
Then they came for the Socialists, but I was not a Socialist, so I did not speak out.
Then they came for the trade unionists, but I was not a trade unionist, so I did not speak out.
Then they came for the Jews, but I was not a Jew, so I did not speak out.
And when they came for me, there was no one left to speak out for me.
Neither “Adolf Hitler” nor “Nazi Party” was mentioned during the one-minute Kassich video. But a furious Trump threatened to sue Kasich if he could find find anything “not truthful” within the ad.
So said the man who has called Mexican immigrants “rapists” and accused President Barack Obama of being a Muslim and an illegal alien.
The Kasich ad is by far the darkest attack so far made against Trump by any candidate–Republican or Democrat. And it raises a disturbing question:
If Donald Trump is America’s Adolf Hitler, who will be its Claus von Stauffenberg?
Colonel Claus Schenk von Stuaffenberg was the German army officer who, on July 20, 1944, tried to assassinate Adolf Hitler.
2016 PRESIDENTIAL CAMPAIGN, ABC NEWS, ADOLF HITLER, BLACKS, CBS NEWS, CLAUS VON STAFFENBERG, CNN, DONALD TRUMP, FACEBOOK, HUEY LONG, ILLEGAL ALILENS, JOAQUIN "EL CHAPO" GUZMAN, JOHN KASICH, LATINOS, MARTIN NIEMOELLER, MUSLIMS, NAZI GERMANY, NBC NEWS, NICCOLO MACHIAVELLI, SS, TERRORISTS, THE CHICAGO SUN-TIMES, THE CHICAGO TRIBUNE, THE HOLOCAUST, THE HUFFINGTON POST, THE LOS ANGELES TIMES, THE NEW YORK TIMES, THE WALL STREET JOURNAL, THE WASHINGTON POST, TWITTER, WEHRMACHT, WORLD WAR 11
In Bureaucracy, History, Military, Politics, Social commentary on December 2, 2015 at 12:17 am
On July 20, 1944, members of the Wehrmacht high command failed to assassinate Adolf Hitler with a bomb hidden in a briefcase.
But two setbacks prevented the conspirators from succeeding.
First, Hitler survived the bomb blast.
Second, the plotters failed to seize the key broadcast facilities of the Reich.
This allowed Hitler to make a late-night speech to the nation, revealing the failed plot and assuring Germans that he was alive. And he swore to flush out the “traitorous swine” who had tried to kill him.
Adolf Hitler
Mass arrests quickly followed. Among the first victims discovered and executed was the conspiracy’s leader, Colonel Claus von Stauffenberg. Standing before a makeshift firing squad at midnight, he cried: “Long live our sacred Germany!”
At least 7,000 persons were arrested by the Gestapo. According to records of the Fuehrer Conferences on Naval Affairs, 4,980 were executed.
Had the conspiracy succeeded, history would have turned out differently:
Thus, history can be altered by the appearance or disappearance of a single individual.
Which brings us back to Donald Trump.
Donald Trump
Since declaring his candidacy for the Presidency on June 16, Trump has been the first choice among the Republican base.
At first, he was dismissed as a bad joke–by Republican Presidential candidates as well as Democrats.
Surely voters would reject a bombastic, thrice-married “reality show” host who had filed for corporate bankruptcy four times.
Yet from the outset Trump dominated the field–and a series of Republican debates. The other Republican candidates watched him with envy–and desperately tried to steal some of his limelight.
Making made one inflammatory statement after another, he offended one group of potential voters after another. Among those groups:
- Latinos
- Asians
- Muslims
- Blacks
- The disabled
- Women
- Prisoners-of-War
These insults delighted his white, under-educated followers. But they alienated millions of other Americans who might have voted for him.
While some of those offended are unlikely to respond with violence, others have powerful motives–and means–for doing so. Among those groups–and the insults Trump has leveled at them:
- Mexicans: “They’re bringing drugs. They’re bringing crime. They’re rapists.” He’s also promised to “build a great, great wall on our southern border and I will have Mexico pay for that wall.”
- Illegal aliens: Trump has threatened to forcibly deport millions of mostly Mexican and Central American residents.
- Blacks: At a Trump rally in Birmingham, Alabama, he was interrupted by black activist Mercutio Southall, who repeatedly shouted: “Black lives matter!” Trump ordered his removal, and several of his supporters beat and kicked Southall. Later, Trump said: “Maybe he should have been roughed up, because it was absolutely disgusting what he was doing.”
- Trump retweeted an image of a masked, dark-skinned man with a handgun and a series of alleged crime statistics, including: “Blacks killed by whites – 2%”; “Whites killed by blacks – 81%.” The image cites the “Crime Statistics Bureau – San Francisco”–an agency that doesn’t exist.
- Muslims: Trump has boasted he would revive waterboarding of terrorist suspects. He would require Muslims to register with the Federal Government. And he would close “some mosques” if he felt they were being used by Islamic terrorists.
- Islamic terrorists: Trump has bragged that he would “bomb the hell” out of oilfields controlled by the Islamic State of Iraq and Syria (ISIS): “I would absolutely cut off their source of wealth, which is the oil.”
- Joaquin “El Chapo” Guzman: Referring to the Mexican drug lord in a tweet, Trump wrote: “Trump…would kick his ass!” Trump hurriedly called the FBI after he received a death threat from a Twitter account associated with Guzman.
Niccolo Machiavelli, the father of modern politics, warned against hurling threats and insults: “For neither the one nor the other…diminishes the strength of the enemy.

Niccolo Machiavelli
“[Threats make] him more cautious, and [insults increase] his hatred of you, and [make] him more persevering in his efforts to injure you.”
But Trump revels in insulting anyone who dares to challenge him.
In 1935, Louisiana U.S. Senator Huey Long intended to occupy the White House in 1936 and unseat then-President Franklin D. Roosevelt. His “Share Our Wealth” program was hugely popular among millions in Depression-era America.
On September 8, 1935, he was shot and fatally wounded by Carl Austin Weiss, an idealistic young doctor.
His motive: Long had gerrymandered Weiss’ father-in-law, a district judge, out of his district and spread vicious rumors about his ancestry.
Writing about Long’s assassination, historian William Manchester noted: “Huey Long was one of the very few men of whom it can be said that, had he lived, American history would have been dramatically different.”
If the same fate removes Donald Trump from the 2016 Presidential race, future historians may write the same about him.
2016 PRESIDENTIAL CAMPAIGN, ABC NEWS, ADOLF HITLER, BLACKS, CBS NEWS, CLAUS VON STAFFENBERG, CNN, DONALD TRUMP, FACEBOOK, HUEY LONG, ILLEGAL ALILENS, JOAQUIN "EL CHAPO" GUZMAN, JOHN KASICH, LATINOS, MARTIN NIEMOELLER, MUSLIMS, NAZI GERMANY, NBC NEWS, NICCOLO MACHIAVELLI, SS, TERRORISTS, THE CHICAGO SUN-TIMES, THE CHICAGO TRIBUNE, THE HOLOCAUST, THE HUFFINGTON POST, THE LOS ANGELES TIMES, THE NEW YORK TIMES, THE WALL STREET JOURNAL, THE WASHINGTON POST, TWITTER, WEHRMACHT, WORLD WAR 11
In Bureaucracy, History, Military, Politics, Social commentary on December 1, 2015 at 12:01 am
On July 20, 1944, a one-eyed, one-armed man tried to assassinate Adolf Hitler
Colonel Claus Schenk von Stuaffenberg had served with the Wehrmacht in Poland (1939), France (1940) and the Soviet Union (1941). And he had been seriously wounded in its service.
Colonel Claus Schenk von Stuaffenberg
Nevertheless, he now acted as the prime mover for the conspiracy among a growing number of German high command officers to arrest or assassinate Germany’s Fuehrer.
Most of the conspirators wanted to arrest Hitler and surrender to British and American forces–well before the much-feared Russians gained a foothold in Germany.
But Stauffenberg wanted him dead: A live Hitler might eventually be rescued by his Nazi colleagues.
But–how to do it?
Hitler was a closely-guarded target. He was surrounded by fanatical bodyguards who were expert marksmen. He often wore a bulletproof vest and a cap lined with three pounds of laminated steel.
Adolf Hitler
Bundesarchiv, Bild 146-1990-048-29A / CC-BY-SA 3.0 [CC BY-SA 3.0 de (https://creativecommons.org/licenses/by-sa/3.0/de/deed.en)%5D, via Wikimedia Commons
But his single greatest protection–he claimed–was an instinct for danger. He would often suddenly change his schedule–to drop in where he was least expected. Or to suddenly depart an event where he was scheduled to stay a long time.
On November 9, 1939, this instinct saved his life. He had been set to give a long speech at a Munich beer hall before the “Old Fighters” of his storm troopers.
Sixteen years earlier on that day, in 1923, Hitler had led them in a disastrous attempt to overthrow the Bavarian government. Police had put down the effort, killing and wounding about a score of storm troopers in the process.
Hitler himself had later been arrested, tried and convicted for treason–and sentenced to a year’s imprisonment.
But instead of proving to be the end of Nazism, the “Beer Hall Putsch” turned Hitler into a national celebrity. And it launched his career as a legitimate, ultimately successful politician.
So Hitler was expected to speak to his longtime supporters for a long time that evening. Instead, he suddenly cut short his speech and left the beer hall.
Forty-five minutes later, a bomb exploded inside a pillar–before which Hitler had been speaking.
Since then, a series of other assassination attempts had been made against Hitler. All of them involved time-bombs. And all of the would-be assassins were members of the German General Staff.
In one case, a bomb secretly stashed aboard Hitler’s plane failed to explode. In another, an officer who had a bomb strapped to himself unexpectedly found his scheduled meeting with Hitler called off. He had to rush into a bathroom to defuse the bomb before it went off.
So now it was the turn of von Stauffenberg. He would carry his bomb–hidden in a briefcase–into a “Hitler conference” packed with military officers.
But Stauffenberg didn’t intend to be a suicide bomber. He meant to direct the government that would replace that of the Nazis.
His bomb–also rigged with a time-fuse–would be left in the conference room while he found an excuse to leave. After the explosion, he would phone one of his fellow conspirators with the news.
Then, the coup–“Operation Valkyrie”–would be on.
Anti-Nazi conspirators would seize control of key posts of the government. The British and Americans would then be informed of Germany’s willingness to surrender. Provided, of course, that the Russians did not have a say in its postwar future.
The Wehrmacht and Schutzstaffel (SS) had killed millions of Russians. Many had died in combat. Others had been murdered as captives. Still more had been allowed to die by starvation and exposure to the notorious Russian winter.
So the Germans–both Nazi and anti-Nazi–knew what they could expect if soldiers of the Soviet Union reached German soil.
On July 20, 1944, Stauffenberg appeared at Hitler’s well-guarded military headquarters in East Prussia. Like all his other outposts, Hitler had named it–appropriately enough–“Wolf’s Lair.”
“Wolf’s Lair”
Stauffenberg entered the large, concrete building while the conference was in session. He placed his yellow briefcase next to Hitler–who was standing with his generals at a heavy oaken table.
Then Stauffenberg excused himself to take an “urgent” phone call.
At 12:42 p.m. on July 20, 1944, Stauffenberg’s briefcase bomb erupted.
But the Third Reich didn’t come to an end–because, as if miraculously, Hitler had survived.

Hitler shows off the site of the explosion
What had happened?
First, the conference location had been changed–from a wooden building to a concrete one. The concrete absorbed much of the blast.
Second, owing to the summer’s heat, Hitler had ordered all the windows–about ten–opened to let in a breeze. This allowed much of the force of the blast to be dispersed.
Third, and perhaps most important: Stauffenberg had carefully placed his briefcase near Hitler, who was standing next to a heavy oaken support of the conference table.
But after Stauffenberg left the room, Colonel Heinz Brandt, who stood next to Hitler, found the briefcase blocking his legs. So he moved it–to the other side of the heavy oaken support.
When the bomb exploded, Hitler was partially shielded from its full blast. Brandt died, as did two other officers and a stenographer.


.jpg&imgrefurl=https%3A%2F%2Fen.wikipedia.org%2Fwiki%2FDonald_Trump&docid=oUQ97aEz8anNMM&tbnid=QsnpHu5vtl_y5M%3A&w=342&h=465&ved=0ahUKEwiz15vwz7DLAhVBWWMKHYU2CXkQxiAIAg&iact=c&ictx=1)


1984 NOVEL, 9/11, ABC NEWS, ADOLF HITLER, BARACK OBAMA, BILL CLINTON, BIRTH CONTROL, BLACKS, CBS NEWS, CNN, COMMUNISM, DENNIS HASTERT, DISABLED, DISCRIMINATION, DWIGHT D. EISENHOWER, EDWARD R. MURROW, ENVIRONMENTALISTS, FACEBOOK, FAMILY RESEARCH COUNCIL, FRANKLIN D. ROOSEVELT, GAYS, GEORGE C. MARSHALL, GEORGE H.W. BUSH, GEORGE ORWELL, GOP, GREAT SOCIETY, HARRY S. TRUMAN, HISPANICS, HIV MEDICATION, HOUSE OF REPRESENTATIVES, J. ROBERT OPPENHEIMER, JOHN BIRCH SOCIETY, JOHN F. KENNEDY, JOHN STEINBECK, JOSEPH R. MCCARTHY, JOSEPH STALIN, JOSH DUGGAR, KGB, LEE ATWATER, LEON TROTSKY, LESBIANS, LIBERALS, LUCILLE BALL, LYNDON B. JOHNSON, MEDICAL CARE, MEIN KAMPF, MICHAEL DUKAKIS, MICHELLE BACHMANN, MITT ROMNEY, MUSLIMS, NBC NEWS, PETE SEEGER, PROPAGANDA, RELIGION, REPUBLICANS, RICHARD NIXON, RICK SANTORUM, ROBERT WELCH, RODNEY KING RIOTS, SCAPEGOATING, SHARIA LAW, SOCIALISTS, SOVIET UNION, THE LOS ANGELES TIMES, THE NEW YORK TIMES, THE RELIGIOUS FREEDOM RESTORATION ACT, THE WASHINGTON POST, TRANSGENDERS, TWITTER, WILLIAM L. SHIRER, WOMEN, WORLD WAR ii
THE “TWO MINUTES HATE”–A GOP GIFT: PART ONE (OF THREE)
In Bureaucracy, History, Politics, Social commentary on May 19, 2016 at 12:01 amThe Right’s fixation on transgender “dangers” is only the latest in a long string of “enemies” painted by the Republican party.
During the 1960s and 1970s, the “enemy” was blacks. The key to winning votes of racist whites without appearing racist lay in what Republicans called “the Southern Strategy.”
It was this that won Richard Nixon the Presidency in 1968 and 1972 and the White House for George H.W. Bush in 1988.
In a now-infamous 1981 interview, Right-wing political consultant Lee Atwater explained how this worked:
“You start out in 1954 by saying, ‘Nigger, nigger, nigger.’ By 1968 you can’t say ‘nigger’—that hurts you, backfires.
“So you say stuff like, uh, forced busing, states’ rights, and all that stuff, and you’re getting so abstract.
“Now, you’re talking about cutting taxes, and all these things you’re talking about are totally economic things and a byproduct of them is, blacks get hurt worse than whites.…
“’We want to cut this,’ is much more abstract than even the busing thing, uh, and a hell of a lot more abstract than ‘Nigger, nigger.’
“So anyway you look at it, race is coming on the back burner.”
Lee Atwater
At the end of his life, Atwater recognized the monster he had helped unleash.
Like Reinhard Heydrich–the designer of the “Final Solution” who, on his deathbed, begged forgiveness for his crimes–Atwater, in a 1991 article for Life, apologized to former Democratic Presidential nominee Michael Dukakis for the “naked cruelty” of the 1988 campaign.
But blacks have by no means been the only targets–and victims–of Republican hate campaigns. A partial list of these would include:
And now transgenders.
George Orwell’s classic 1949 novel, 1984, serves as a better guide to Republican electioneering than any official statement of the GOP.
1984 is set in a futuristic dictatorship called Oceania, whose constantly alternating mortal enemies are Eurasia and Eastasia.
A daily fixture of life in Oceania is the “Two Minutes Hate.” During this, Party members must watch a film depicting the Party’s enemies and express their hatred for them in exactly two minutes.
Chief among these is Emmanuel Goldstein, who is obviously based on Leon Trotsky, the longtime antagonist of Joseph Stalin, dictator of the Soviet Union for almost 30 years.
The “Two Minutes Hate” serves as a form of brainwashing, whose purpose is to whip ordinary citizens into a frenzy of hatred and loathing for whoever the Party designates as its–and their–mortal enemies.
Since the end of World War II, Republicans have regularly hurled the charge of “treason” against anyone who dared to run against them for office or think other than Republican-approved thoughts.
Republicans had been locked out of the White House from 1933 to 1952, during the administrations of Franklin D. Roosevelt and Harry S. Truman.
Determined to regain the Presidency by any means, they found that attacking the integrity of their fellow Americans a highly effective tactic.
During the 1950s, Wisconsin Senator Joseph R. McCarthy rode a wave of paranoia to national prominence–by attacking the patriotism of anyone who disagreed with him.
Joseph McCarthy
Elected to the Senate in 1946, he rose to national prominence on February 9, 1950, after giving a fiery speech in Wheeling, West Virginia:
“The State Department is infested with communists. I have here in my hand a list of 205—a list of names that were made known to the Secretary of State as being members of the Communist Party and who nevertheless are still working and shaping policy in the State Department.”
Americans were already growing increasingly fearful of Communism:
But anti-communism as a lever to political advancement sharply accelerated following McCarthy’s speech. Republicans–resentful at being denied the White House since 1932–seized upon anti-communism as their passport to power.
No American–no matter how prominent–was safe from the accusation of being a Communist or a Communist sympathizer–”a Comsymp” or “fellow traveler” in the style of the era.
Among those accused:
Even “untouchable” Republicans became targets for such slander.
The most prominent of these was President Dwight D. Eisenhower–labeled ”a conscious, dedicated agent of the Communist Conspiracy” by Robert Welch, who founded the John Birch Society in 1958.
Share this: