Posts Tagged ‘SEX CRIMES’
2016 PRESIDENTIAL ELECTION, 2020 PRESIDENTIAL ELECTION, ABC NEWS, ALTERNET, AMERICABLOG, AP, ASSAULT, BABY BOOMER RESISTANCE, BLACK LIBERATION ARMY, BLACK LIVES MATTER, BLACKS, BLOOMBERG, BURGLARY, BUZZFEED, CBS NEWS, CNN, CRIME, CROOKS AND LIARS, DAILY KOZ, DARREN WILSON, DONALD TRUMP, DRUDGE REPORT, DRUGS, EMERYVILLE, FBI, FELONIOUS ASSAULT, FELONY SEX CRIMES, FERGUSON POLICE DEPARTMENT, FIVETHIRTYEIGHT, GEORGE FLOYD, GRAND LARCENY, HARPER’S MAGAZINE, HISPANICS, HUFFINGTON POST, JASON BLAKE, JESSE JACKSON, KENOSHA COUNTY, MANSLAUGHTER, MARTIN LUTHER KING, MEDIA MATTERS, MICHAEL BROWN, MISDEMEANOR ASSAULT, MISDEMEANOR ASSAULT AND RELATED OFFENSES, MISDEMEANOR SEX CRIMES, MOTHER JONES, MOVEON, MSNBC, MURDER, NBC NEWS, NEW YORK CITY, NEW YORK POLICE DEPARTMENT, NEWSWEEK, NON-NEGLIGENT MANSLAUGHTER, NPR, OAKLAND, PBS NEWSHOUR, PETIT LARCENY, POLITICO, POLITICUSUSA, PROACTIVE PROPERTY CRIMES, RAPE, RAW STORY, RESTRAINING ORDER, REUTERS, ROBBERY, ROBERT DALEY, RUSTEN SHESKEY, SALON, SAN FRANCISCO, SAN JOSE, SEATTLE TIMES, SEX CRIMES, SEXUAL ASSAULT, SHOOTINGS, SLATE, TALKING POINTS MEMO, TARGET BLUE: AN INSIDER'S VIEW OF THE NYPD (BOOK), THE ATLANTIC, THE CHICAGO SUN-TIMES, THE CHICAGO TRIBUNE, THE DAILY BEAST, THE DAILY BLOG, THE GUARDIAN, THE HILL, THE HUFFINGTON POST, THE LOS ANGELES TIMES, THE NATION, THE NEW REPUBLIC, THE NEW YORK TIMES, THE VILLAGE VOICE, THE WALL STREET JOURNAL, THE WASHINGTON POST, THINKPROGRESS, TIME, TRUTHDIG, TRUTHOUT, TWITTER, TWO POLITICAL JUNKIES, U.S. NEWS & WORLD REPORT, UPI, USA TODAY, WALNUT CREEK, WONKETTE
In Bureaucracy, History, Law, Law Enforcement, Politics, Social commentary on October 12, 2023 at 12:10 am
On August 23, 2021, Jacob S. Blake, a 29-year-old black man, was shot and seriously injured by police in Kenosha, Wisconsin.
The shooting occurred as officers attempted to arrest him. Blake was tasered as he scuffled with police. When he opened the driver’s door to his SUV and leaned in, Officer Rusten Sheskey fired seven shots, striking him four times in the back.
Blake is now paralyzed from the waist down, and may never walk again.
Protests followed.
Kenosha County declared a state of emergency overnight on August 24 after police vehicles were damaged, a dump truck set on fire, and the local courthouse vandalized. Police urged 24-hour businesses to close owing to armed robberies and shots being fired. Up to 200 members of the Wisconsin National Guard were deployed to maintain public safety.
At the time of the shooting, Blake faced a criminal complaint charging him with third-degree sexual assault in connection with domestic abuse on July 6.
The officers had come to arrest Blake for violating a restraining order stemming from that complaint. A 911 call on August 23 alerted them that Blake was at the home of his alleged victim.

A sample restraining order
The restraining order stemmed from a criminal complaint, which accused Blake of breaking into the home of a woman he knew and sexually assaulting her in May. The victim told police she was asleep when Blake broke in at 6 a.m. and said, “I want my shit.”
After Blake left, she realized her keys were missing and “immediately called 911,” the complaint said.
An arrest warrant was issued on July 7.
On August 9, 2014, a similar police/media incident had occurred.
Michael Brown, an 18-year-old black man, was fatally shot by a white police officer named Darren Wilson in Ferguson, Missouri, a suburb of St. Louis.
Brown’s 22-year-old friend, Dorian Johnson claimed that Wilson shot him in the back. Wilson claimed he shot Brown after the latter charged at him.
An FBI investigation found that there was no evidence that Brown had his hands up in surrender or said “don’t shoot” before he was shot. It also found that Brown was struck six times, all in the front of his body.
The shooting ignited nationwide protests.
Yet many of the media “covering” the story refused to note that, shortly before his shooting, a video camera taped Brown robbing a grocery store and manhandling its owner.
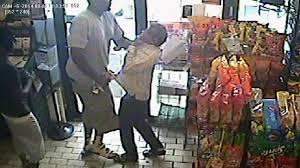
Michael Brown (left) roughing up a store owner
Had this been more widely noted, “Saint Michael” would have been seen as a mere thug who learned that assaulting an armed cop wasn’t the same as attacking an unarmed store owner.
On May 25, 2020, George Floyd, a former black security guard, was murdered in Minneapolis, Minnesota. While Floyd was handcuffed and lying face down on a city street during an arrest, Derek Chauvin, a white Minneapolis police officer, kept his knee on the right side of Floyd’s neck for eight minutes and 46 seconds.
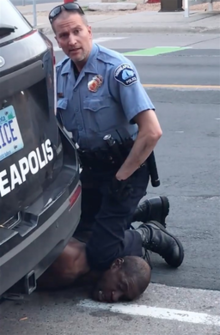
Death of George Floyd
Across the nation, cities were convulsed by protests—including those in the San Francisco Bay Area. Among these: Oakland, San Jose, Emeryville, Walnut Creek and San Francisco itself.
On May 30, an initially peaceful protest march exploded into looting shortly before 9 p.m. as looters broke off and began smashing shop windows and ransacking stores in Union Square and on Market Street.
Among the stores looted: A Sak’s Off-Fifth Avenue, an Old Navy clothing store, a Cartier Boutique and a Coach store. Looters especially targeted CVS and Walgreens drugstores. Liquor stores and a BevMo were also hit.
“Thirty businesses were looted or destroyed,” said David Perry, from the Union Square Business Improvement District.
Undoubtedly many of victims of those looters and arsonists had been horrified by the Floyd killing. But many of them undoubtedly lost sympathy for the Black Lives Matter movement as they surveyed the wreckage of their stores.
Store owners were infuriated at having to replace stock that had been stolen or destroyed. And employees resented having to clean up the wreckage. Some stores no doubt were forced to close, leaving their former employees suddenly jobless.
And President Donald Trump quickly moved to capitalize on that resentment. His brand of “divide and rule” politics had brought him to the White House in 2016. And he was determined to play on white fears of further black crime to win a second term.
White fears of black crime are reflected in the crime rate statistics for New York City.
While Blacks make up 14.2% of New York City’s population, they comprise:
- 57.8% of its murder and non-negligent manslaughter arrests;
- 40.5% of its rape arrests;
- 38.2% of its known other felony sex crime arrests;
- 65.5% of its robbery arrests;
- 52.3% of its felonious assault arrests;
- 50.9% of its grand larceny arrests;
- 67.1% of its shooting arrests;
- 50.7% of its drug felony arrests;
- 42.2% of its drug misdemeanor arrests;
- 46.2% of its felony stolen property arrests;
- 52.9% of its misdemeanor stolen property arrests;
- 58.6% of its violent crime suspects;
- 59.8% of its juvenile crime complaint arrests.
This is admittedly unfair to those blacks who are law-abiding citizens. But the fear factor will continue until crime rates among blacks start falling dramatically.
2016 PRESIDENTIAL ELECTION, 2020 PRESIDENTIAL ELECTION, ABC NEWS, ALTERNET, AMERICABLOG, AP, ASSAULT, BABY BOOMER RESISTANCE, BLACK LIBERATION ARMY, BLACK LIVES MATTER, BLACKS, BLOOMBERG, BURGLARY, BUZZFEED, CBS NEWS, CNN, CRIME, CROOKS AND LIARS, DAILY KOZ, DARREN WILSON, DONALD TRUMP, DRUDGE REPORT, DRUGS, EMERYVILLE, FACEBOOK, FBI, FELONIOUS ASSAULT, FELONY SEX CRIMES, FERGUSON POLICE DEPARTMENT, FIVETHIRTYEIGHT, GEORGE FLOYD, GRAND LARCENY, HARPER’S MAGAZINE, HISPANICS, HUFFINGTON POST, JACOB BLAKEOB, JASON BLAKE, JESSE JACKSON, KENOSHA COUNTY, MANSLAUGHTER, MARTIN LUTHER KING, MEDIA MATTERS, MICHAEL BROWN, MISDEMEANOR ASSAULT, MISDEMEANOR ASSAULT AND RELATED OFFENSES, MISDEMEANOR SEX CRIMES, MOTHER JONES, MOVEON, MSNBC, MURDER, NBC NEWS, NEW YORK CITY, NEW YORK POLICE DEPARTMENT, NEWSWEEK, NON-NEGLIGENT MANSLAUGHTER, NPR, OAKLAND, PBS NEWSHOUR, PETIT LARCENY, POLITICO, POLITICUSUSA, PROACTIVE PROPERTY CRIMES, RAPE, RAW STORY, RESTRAINING ORDER, REUTERS, ROBBERY, ROBERT DALEY, RUSTEN SHESKEY, SALON, SAN FRANCISCO, SAN JOSE, SEATTLE TIMES, SEX CRIMES, SEXUAL ASSAULT, SHOOTINGS, SLATE, TALKING POINTS MEMO, TARGET BLUE: AN INSIDER'S VIEW OF THE NYPD (BOOK), THE ATLANTIC, THE CHICAGO SUN-TIMES, THE CHICAGO TRIBUNE, THE DAILY BEAST, THE DAILY BLOG, THE GUARDIAN, THE HILL, THE HUFFINGTON POST, THE LOS ANGELES TIMES, THE NATION, THE NEW REPUBLIC, THE NEW YORK TIMES, THE VILLAGE VOICE, THE WALL STREET JOURNAL, THE WASHINGTON POST, THINKPROGRESS, TIME, TRUTHDIG, TRUTHOUT, TWITTER, TWO POLITICAL JUNKIES, U.S. NEWS & WORLD REPORT, UPI, USA TODAY, WALNUT CREEK, WONKETTE
In Bureaucracy, History, Law, Law Enforcement, Politics, Social commentary on October 11, 2023 at 12:10 am
On May 16, 2022, a white supremacist shot and murdered 10 people and wounded three others at the Tops Supermarket in Buffalo, New York.
Eleven victims were black; two were white.
The mass shooting once again ignited calls for gun control and a national dialogue on race.
Undoubtedly the motivation for the killings was race. But the sensationalistic publicity given this crime obscured a brutal truth ignored by liberals—and blacks:
Blacks kill far more blacks than whites do. And blacks are responsible for a disproportionate portion of crimes.
In 1993, this was publicly acknowledged by no less than Jesse Jackson, the famous civil rights activist, Baptist minister and former disciple of Martin Luther King, Jr.:
“There is nothing more painful to me at this stage in my life than to walk down the street and hear footsteps and start thinking about robbery, then look around and see somebody white and feel relieved.”
Blacks make up 14.2% of the American population in 2023, according to the Pew Research Center.
But they committed 52% of homicides between 1980 and 2008, according to the Justice Department’s Bureau of Justice Statistics. Only 45% of whites were offenders in such cases.
Blacks were disproportionately likely to commit homicide and to be the victims.
In 2008 blacks were seven times more likely than whites to commit homicide. And they were six times more likely than whites to be homicide victims.
According to the FBI, blacks were responsible for 38% of murders, compared to 31.1% for whites, in 2013.
From 2011 to 2013, 38.5% of people arrested for murder, manslaughter, rape, robbery, and aggravated assault were black.

In 1971, Robert Daley, a reporter for the New York Times, became a deputy police commissioner for the New York Police Department (NYPD).
In that capacity, he saw the NYPD from the highest levels to the lowest—from the ornate, awe-inspiring office of Police Commissioner Patrick Murphy to the gritty, sometimes blood-soaked streets of New York.
He spent one year on the job before resigning—later admitting that when he agreed to take the job, he got more than he bargained for.
For the NYPD, 1972 proved to be a tumultuous year. Among those challenges faced were the murders of several police officers, committed by members of the militant Black Liberation Army.
Two of those murdered officers were Waverly Jones and Joseph Piagentini. Jones was black, Piagentini white; both were partners. Both were shot in the back without a chance to defend themselves.
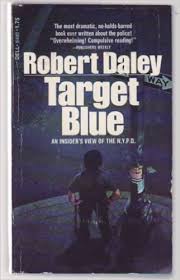
Writing about these murders in a bestselling 1973 book—Target Blue: An Insider’s View of the N.Y.P.D.—Daley noted:
- Jones and Piagentini were the sixth and seventh policemen—of ten—murdered in 1971.
- About 18 men were involved in these murders. All were black.
- The city’s politicians knew this—and so did Commissioner Murphy. None dared say so publicly.
“But the fact remained,” wrote Daley, “that approximately 65% of the city’s arrested murderers, muggers, armed robbers, proved to be black men; about 15% were of Hispanic origin; and about 20% were white [my Italics].”
The overall racial breakdown of the city was approximately:
- Whites 63%
- Blacks 20%
- Hispanics 17%
Stated another way: Blacks, who made up 20% of the city’s population, were responsible for 65% of the city’s major crimes.
Or, as Daley himself put it: “So the dangerous precincts, any cop would tell you, were the black precincts.”
That was 50 years ago.
In 2018, the Bureau of Justice Statistics of the U.S. Department of Justice found:
- Blacks were disproportionately represented among homicide victims and offenders.
- Whites committed 8% of the reported murders of blacks.
- Whites murdered other whites in 80.7% of the cases.
- Blacks were responsible for 15.5% of white murders.
- Blacks were responsible for 88.9% of the murders of blacks.
- Half of all robbery offenders were black.
- Blacks were responsible for a third of aggravated assaults.
- More than a fifth of blacks were responsible for simple assaults.
- Blacks made up 22% of those arrested for rape or sexual assault.
Now, consider the following statistics released by the NYPD for “Crime and Enforcement Activity in New York City” in 2022:
Murder and Non-Negligent Manslaughter Victims
Murder and Non-Negligent Manslaughter Suspects
Murder and Non-Negligent Manslaughter Arrestees
Rape Victims
Rape Suspects
Rape Arrestees
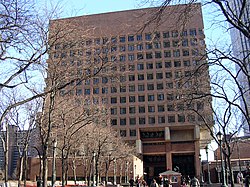
NYPD Headquarters at One Police Plaza
Other Felony Sex Crimes Victims
Other Felony Sex Crime Suspects
Other Felony Sex Crime Arrestees
Robbery Victims
Robbery Suspects
Robbery Arrestees
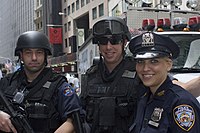
NYPD officers
Nick.Allen, CC BY 2.0 <https://creativecommons.org/licenses/by/2.0>, via Wikimedia Commons
Misdemeanor Assault Victims
Misdemeanor Assault Suspects
Misdemeanor Assault Arrestees
Felonious Assault Victims
Felonious Assault Suspects
Felonious Assault Arrestees
Grand Larceny Victims
Grand Larceny Suspects
Grand Larceny Arrestees
Firearm Arrest Population
Shooting Victims
Shooting Suspects
Shooting Arrestees
Drug Felony Arrest Population
Drug Misdemeanor Arrestees
Misdemeanor Sex Crime Victims
Misdemeanor Sex Crime Suspects
Misdemeanor Sex Crime Arrestees
Misdemeanor Stolen Property Arrest Population
Felony Stolen Property Arrest Population
Petit Larceny Victims
Petit Larceny Suspects
Petit Larceny Arrestees
Misdemeanor Criminal Mischief Victims
Misdemeanor Criminal Mischief Suspects
Misdemeanor Criminal Mischief Arrestees
Reported Crime Complaint Juvenile Victims
Juvenile Crime Complaint Suspects
Juvenile Arrest Population
Violent Crime
2016 PRESIDENTIAL ELECTION, 2020 PRESIDENTIAL ELECTION, ABC NEWS, ALTERNET, AMERICABLOG, AP, ASSAULT, BABY BOOMER RESISTANCE, BLACK LIBERATION ARMY, BLACK LIVES MATTER, BLACKS, BLOOMBERG, BURGLARY, BUZZFEED, CBS NEWS, CNN, CRIME, CROOKS AND LIARS, DAILY KOZ, DARREN WILSON, DONALD TRUMP, DRUDGE REPORT, DRUGS, EMERYVILLE, FACEBOOK, FBI, FELONIOUS ASSAULT, FELONY SEX CRIMES, FERGUSON POLICE DEPARTMENT, FIVETHIRTYEIGHT, GEORGE FLOYD, GRAND LARCENY, HARPER’S MAGAZINE, HISPANICS, HUFFINGTON POST, JASON BLAKE, KENOSHA COUNTY, MANSLAUGHTER, MEDIA MATTERS, MICHAEL BROWN, MISDEMEANOR ASSAULT, MISDEMEANOR ASSAULT AND RELATED OFFENSES, MISDEMEANOR SEX CRIMES, MOTHER JONES, MOVEON, MSNBC, MURDER, NBC NEWS, NEW YORK CITY, NEW YORK POLICE DEPARTMENT, NEWSWEEK, NON-NEGLIGENT MANSLAUGHTER, NPR, OAKLAND, PBS NEWSHOUR, PETIT LARCENY, POLITICO, POLITICUSUSA, PROACTIVE PROPERTY CRIMES, RAPE, RAW STORY, RESTRAINING ORDER, REUTERS, ROBBERY, ROBERT DALEY, RUSTEN SHESKEY, SALON, SAN FRANCISCO, SAN JOSE, SEATTLE TIMES, SEX CRIMES, SEXUAL ASSAULT, SHOOTINGS, SLATE, TALKING POINTS MEMO, TARGET BLUE: AN INSIDER'S VIEW OF THE NYPD (BOOK), THE ATLANTIC, THE CHICAGO SUN-TIMES, THE CHICAGO TRIBUNE, THE DAILY BEAST, THE DAILY BLOG, THE GUARDIAN, THE HILL, THE HUFFINGTON POST, THE LOS ANGELES TIMES, THE NATION, THE NEW REPUBLIC, THE NEW YORK TIMES, THE VILLAGE VOICE, THE WALL STREET JOURNAL, THE WASHINGTON POST, THINKPROGRESS, TIME, TRUTHDIG, TRUTHOUT, TWITTER, TWO POLITICAL JUNKIES, U.S. NEWS & WORLD REPORT, UPI, USA TODAY, WALNUT CREEK, WONKETTE
In Bureaucracy, History, Law, Law Enforcement, Politics, Social commentary on May 20, 2022 at 12:12 am
On August 23, 2021, Jacob S. Blake, a 29-year-old black man, was shot and seriously injured by police in Kenosha, Wisconsin.
The shooting occurred as officers attempted to arrest him. Blake was tasered as he scuffled with police. When he opened the driver’s door to his SUV and leaned in, Officer Rusten Sheskey fired seven shots, striking him four times in the back.
Blake is now paralyzed from the waist down, and may never walk again.
Protests followed.
Kenosha County declared a state of emergency overnight on August 24 after police vehicles were damaged, a dump truck set on fire, and the local courthouse vandalized. Police urged 24-hour businesses to close owing to armed robberies and shots being fired. Up to 200 members of the Wisconsin National Guard were deployed to maintain public safety.
Missing from the story—in most news media—has been one crucial fact:
At the time of the shooting, Blake faced a criminal complaint charging him with third-degree sexual assault in connection with domestic abuse on July 6.
The officers had come to arrest Blake for violating a restraining order stemming from that complaint. A 911 call on August 23 alerted them that Blake was at the home of his alleged victim.
A sample restraining order
The restraining order stemmed from a criminal complaint, which accused Blake of breaking into the home of a woman he knew and sexually assaulting her in May. The victim told police she was asleep when Blake broke in at 6 a.m. and said, “I want my shit.”
She told police that Blake used his finger to sexually assault her. She said the incident “caused her pain and humiliation and was done without her consent.”
After Blake left, she realized her keys were missing and “immediately called 911,” the complaint said.
An arrest warrant was issued on July 7.
On August 9, 2014, a similar police/media incident had occurred.
Michael Brown, an 18-year-old black man, was fatally shot by a white police officer named Darren Wilson in Ferguson, Missouri, a suburb of St. Louis.
Brown’s 22-year-old friend, Dorian Johnson claimed that Wilson shot him in the back. Wilson claimed he shot Brown after the latter charged at him.
An FBI investigation found that there was no evidence that Brown had his hands up in surrender or said “don’t shoot” before he was shot. It also found that Brown was struck six times, all in the front of his body.
The shooting ignited nationwide protests.
Yet many of the media “covering” the story refused to note that, shortly before his shooting, a video camera taped Brown robbing a grocery store and manhandling its owner.
Michael Brown (left) roughing up a store owner
Had this been more widely noted, “Saint Michael” would have been seen as a mere thug who learned that assaulting a cop wasn’t the same as attacking a store owner.
On May 25, George Floyd, a former black security guard, was murdered in Minneapolis, Minnesota. While Floyd was handcuffed and lying face down on a city street during an arrest, Derek Chauvin, a white Minneapolis police officer, kept his knee on the right side of Floyd’s neck for eight minutes and 46 seconds.
Death of George Floyd
Across the nation, cities were convulsed by protests—including those in the San Francisco Bay Area. Among these: Oakland, San Jose, Emeryville, Walnut Creek and San Francisco itself.
On May 30, an initially peaceful protest march exploded into looting shortly before 9 p.m. as looters broke off and began smashing shop windows and ransacking stores in Union Square and on Market Street.
Among stores looted: A Sak’s Off-Fifth Avenue, an Old Navy clothing store, a Cartier Boutique and a Coach store. Looters especially targeted CVS and Walgreens drugstores. Liquor stores and a BevMo were also hit.
“Thirty businesses were looted or destroyed,” said David Perry, from Union Square Business Improvement District.
Undoubtedly many of victims of those looters and arsonists had been horrified by the Floyd killing. But many of them undoubtedly lost sympathy for the Black Lives Matter movement as they surveyed the wreckage of their stores.
Store owners were infuriated at having to replace stock that had been stolen or destroyed. And employees resented having to clean up the wreckage. Some stores no doubt were forced to close, leaving their former employees suddenly jobless.
And President Donald Trump quickly moved to capitalize on that resentment. His brand of “divide and rule” politics brought him to the White House in 2016. And he was determined to play on white fears of further black crime to win a second term.
White fears of black crime are reflected in the crime rate statistics for New York City.
While Blacks make up 24.3% of New York City’s population, they comprise:
- 58.0% of its murder and non-negligent manslaughter arrests;
- 40.7% of its rape arrests;
- 34.6% of its known other felony sex crime arrests;
- 59.4% of its robbery arrests;
- 51.8% of its felonious assault arrests;
- 51.7% of its grand larceny arrests;
- 71.6% of its shooting arrests;
- 45.0% of its drug felony arrests;
- 48.5% of its drug misdemeanor arrests;
- 54.7% of its felony stolen property arrests;
- 45.9% of its misdemeanor stolen property arrests;
- 51.8% of its violent crime suspects;
- 60.0% of its juvenile crime complaint arrests.
This is admittedly unfair to those blacks who are law-abiding citizens. But the fear factor will continue until crime rates among blacks start falling dramatically.
2016 PRESIDENTIAL ELECTION, 2020 PRESIDENTIAL ELECTION, ABC NEWS, ALTERNET, AMERICABLOG, AP, ASSAULT, BABY BOOMER RESISTANCE, BLACK LIBERATION ARMY, BLACK LIVES MATTER, BLACKS, BLOOMBERG, BURGLARY, BUZZFEED, CBS NEWS, CNN, CRIME, CROOKS AND LIARS, DAILY KOZ, DARREN WILSON, DONALD TRUMP, DRUDGE REPORT, DRUGS, EMERYVILLE, FACEBOOK, FBI, FELONIOUS ASSAULT, FELONY SEX CRIMES, FERGUSON POLICE DEPARTMENT, FIVETHIRTYEIGHT, GEORGE FLOYD, GRAND LARCENY, HARPER’S MAGAZINE, HISPANICS, HUFFINGTON POST, JACOB BLAKEOB, JASON BLAKE, KENOSHA COUNTY, MANSLAUGHTER, MEDIA MATTERS, MICHAEL BROWN, MISDEMEANOR ASSAULT, MISDEMEANOR ASSAULT AND RELATED OFFENSES, MISDEMEANOR SEX CRIMES, MOTHER JONES, MOVEON, MSNBC, MURDER, NBC NEWS, NEW YORK CITY, NEW YORK POLICE DEPARTMENT, NEWSWEEK, NON-NEGLIGENT MANSLAUGHTER, NPR, OAKLAND, PBS NEWSHOUR, PETIT LARCENY, POLITICO, POLITICUSUSA, PROACTIVE PROPERTY CRIMES, RAPE, RAW STORY, RESTRAINING ORDER, REUTERS, ROBBERY, ROBERT DALEY, RUSTEN SHESKEY, SALON, SAN FRANCISCO, SAN JOSE, SEATTLE TIMES, SEX CRIMES, SEXUAL ASSAULT, SHOOTINGS, SLATE, TALKING POINTS MEMO, TARGET BLUE: AN INSIDER'S VIEW OF THE NYPD (BOOK), THE ATLANTIC, THE CHICAGO SUN-TIMES, THE CHICAGO TRIBUNE, THE DAILY BEAST, THE DAILY BLOG, THE GUARDIAN, THE HILL, THE HUFFINGTON POST, THE LOS ANGELES TIMES, THE NATION, THE NEW REPUBLIC, THE NEW YORK TIMES, THE VILLAGE VOICE, THE WALL STREET JOURNAL, THE WASHINGTON POST, THINKPROGRESS, TIME, TRUTHDIG, TRUTHOUT, TWITTER, TWO POLITICAL JUNKIES, U.S. NEWS & WORLD REPORT, UPI, USA TODAY, WALNUT CREEK, WONKETTE
In Bureaucracy, History, Law, Law Enforcement, Politics, Social commentary on May 19, 2022 at 12:10 am
On May 16, 2022, a white supremacist shot and murdered 10 people and wounded three others at the Tops Supermarket in Buffalo, New York.
Eleven victims were black; two were white.
The mass shooting has once again ignited calls for gun control and a national dialogue on race.
Undoubtedly the motivation for the killings was race. But the sensationalistic publicity given this crime obscures a brutal truth ignored by liberals—and blacks:
Blacks kill far more blacks than whites do. And blacks are responsible for a disproportionate portion of crimes.
Blacks make up 13% of the American population, according to the 2010 census of the United States.
But they committed 52% of homicides between 1980 and 2008, according to the Justice Department’s Bureau of Justice Statistics. Only 45% of whites were offenders in such cases.
Blacks were disproportionately likely to commit homicide and to be the victims.
In 2008 blacks were seven times more likely than whites to commit homicide. And they were six times more likely than whites to be homicide victims.
According to the FBI, blacks were responsible for 38% of murders, compared to 31.1% for whites, in 2013.
From 2011 to 2013, 38.5% of people arrested for murder, manslaughter, rape, robbery, and aggravated assault were black.
In 1971, Robert Daley, a reporter for the New York Times, became a deputy police commissioner for the New York Police Department (NYPD).
In that capacity, he saw the NYPD from the highest levels to the lowest—from the ornate, awe-inspiring office of Police Commissioner Patrick Murphy to the gritty, sometimes blood-soaked streets of New York.
He spent one year on the job before resigning—later admitting that when he agreed to take the job, he got more than he bargained for.
For the NYPD, 1972 proved to be a tumultuous year. Among those challenge faced were the murders of several police officers, committed by members of the militant Black Liberation Army.
Two of those murdered officers were Waverly Jones and Joseph Piagentini. Jones was black, Piagentini white; both were partners. Both were shot in the back without a chance to defend themselves.
Writing about these murders in a bestselling 1973 book—Target Blue: An Insider’s View of the N.Y.P.D.—Daley noted:
- Jones and Piagentini were the sixth and seventh policemen—of ten—murdered in 1971.
- About 18 men were involved in these murders. All were black.
- The city’s politicians knew this—and so did Commissioner Murphy. None dared say so publicly.
“But the fact remained,” wrote Daley, “that approximately 65% of the city’s arrested murderers, muggers, armed robbers, proved to be black men; about 15% were of Hispanic origin; and about 20% were white [my Italics].”
The overall racial breakdown of the city was approximately:
- Whites, 63%;
- Blacks, 20%;
- Hispanics 17%.
Stated another way: Blacks, who made up 20% of the city’s population, were responsible for 65% of the city’s major crimes.
Or, as Daley himself put it: “So the dangerous precincts, any cop would tell you, were the black precincts.”
That was 50 years ago.
Now, consider the following statistics released by the NYPD for “Crime and Enforcement Activity in New York City” in 2019:
Murder and Non-Negligent Manslaughter Victims
- Black (56.6%)
- Hispanic (31.2%)
- White (4.9%)
- Asian/Pacific Islander (6.9%)
Murder and Non-Negligent Manslaughter Suspects
- Black (62.4%)
- Hispanic (30.8%)
- White (3.0%)
- Asian/Pacific Islander (3.8%)
Murder and Non-Negligent Manslaughter Arrestees
- Black 58.0%
- Hispanic 35.2%
- White 3.3%
- Asian/Pacific Islander 3.0%
Rape Victims
Rape Suspects
- Black 46.5%)
- Hispanic (34.8%)
- White (10.8%)
- Asian/Pacific Islander (7.3%)
Rape Arrestees
- Black (40.7%)
- Hispanic (45.4%
- )White (6.7%)
- Asian/Pacific Islander (7.0%)
NYPD Headquarters at One Police Plaza
Other Felony Sex Crimes Victims
- Black (33.8%)
- Hispanic (37.3%)
- White (21.3%)
- Asian/Pacific Islander (7.0%)
Other Felony Sex Crime Suspects
- Black (41.6%)
- Hispanic (37.5%)
- White (12.9%)
- Asian/Pacific Islander (7.3%)
Other Felony Sex Crime Arrestees
- Black (34.6%)
- Hispanic (47.4%)
- White (11.3%)
- Asian /Pacific Islander (6.4%)
Robbery Victims
Robbery Suspects
- Black (66.2%
- Hispanic (27.1%)
- White (4.3%)
- Asian/Pacific islander (2.3%)
Robbery Arrestees
- Black (59.4%)
- Hispanic (32.2%)
- White (5.2%)
- Asian/Pacific Islander (3.2%)
NYPD officers
Nick.Allen, CC BY 2.0 <https://creativecommons.org/licenses/by/2.0>, via Wikimedia Commons
Misdemeanor Assault Victims
Misdemeanor Assault Suspects
Misdemeanor Assault Arrestees
Felonious Assault Victims
Felonious Assault Suspects
- Black (53.4%)
- Hispanic (32.6%)
- White (7.9%)
- Asian/Pacific Islanders (5.8%)
Felonious Assault Arrestees
- Black (51. 8%)
- Hispanic (33.1%)
- White (8.3%)
- Asian/Pacific Islanders (6.4%)
Grand Larceny Victims
- Black (24.4%)
- Hispanic (23.0%)
- White (35.9%)
- Asian/Pacific Islanders (15.7%)
Grand Larceny Suspects
- Black (50.5%)
- Hispanic (23.5%)
- White (11.7%)
- Asian/Pacific Islanders (3.9%)
Grand Larceny Arrestees
- Black (51.7%)
- Hispanic (28.5%)
- White (13.7%)
- Asian/Pacific Islanders (6.0%)
Firearm Arrest Population
Shooting Victims
Shooting Suspects
- Black (74.4%)
- Hispanic (22.0%)
- White (2.4%)
- Asian/Pacific Islander (1.1%)
Shooting Arrestees
- Black (71.6%)
- Hispanic (24.1%)
- White (2.7%)
- Asian/Pacific Islander (1.5%)
Drug Felony Arrest Population
- Black (45.0%)
- Hispanic (40.2%)
- White (9.7%)
- Asian Pacific Islanders (4.9%)
Drug Misdemeanor Arrestees
- Black (48.5%)
- Hispanic (35.3%)
- White (12.5%)
- Asian Pacific Islanders (3.6%)
Misdemeanor Sex Crime Victims
- Black (35.5%)
- Hispanic (36.7%)
- White (18.6%)
- Asian/Pacific Islanders (8.6%)
Misdemeanor Sex Crime Suspects
- Black (42.4%)
- Hispanic (34.2%)
- White (14.0%)
- Asian/Pacific Islanders (8.7%)
Misdemeanor Sex Crime Arrestees
- Black (52.5%)
- Hispanic (28.9%)
- White (14.5%)
- Asian/Pacific Islanders (4.0%)
Misdemeanor Stolen Property Arrest Population
- Black (45.9%)
- Hispanic (31.9%)
- White (16.8%)
- Asian/Pacific Islanders (5.1%)
Felony Stolen Property Arrest Population
- Black (54.7%)
- Hispanic (28.6%)
- White (11.5%)
- Asian/Pacific Islanders (5.0%)
Petit Larceny Victims
- Black (31.6%)
- Hispanic (29.9%)
- White (28.8%)
- Asian/Pacific Islanders (12.7%)
Petit Larceny Suspects
- Black (53.8%)
- Hispanic (26.8%)
- White (15.7%)
- Asian/Pacific Islanders (3.3%)
Petit Larceny Arrestees
- Black (44.7%)
- Hispanic (32.5%)
- White (17.9%)
- Asian/Pacific Islanders (3.3%)
Misdemeanor Criminal Mischief Victims
- Black (38.5%)
- Hispanic (29.8%)
- White (19.5%)
- Asian/Pacific Islanders (11.2%)
Misdemeanor Criminal Mischief Suspects
Misdemeanor Criminal Mischief Arrestees
Reported Crime Complaint Juvenile Victims
Juvenile Crime Complaint Suspects
Juvenile Arrest Population
2016 PRESIDENTIAL ELECTION, 2020 PRESIDENTIAL ELECTION, ABC NEWS, ALTERNET, AMERICABLOG, AP, ASSAULT, BABY BOOMER RESISTANCE, BLACK LIBERATION ARMY, BLACK LIVES MATTER, BLACKS, BLOOMBERG, BURGLARY, BUZZFEED, CBS NEWS, CNN, CRIME, CROOKS AND LIARS, DAILY KOZ, DARREN WILSON, DONALD TRUMP, DRUDGE REPORT, DRUGS, EMERYVILLE, FACEBOOK, FBI, FELONIOUS ASSAULT, FELONY SEX CRIMES, FERGUSON POLICE DEPARTMENT, FIVETHIRTYEIGHT, GEORGE FLOYD, GRAND LARCENY, HARPER’S MAGAZINE, HISPANICS, HUFFINGTON POST, JASON BLAKE, KENOSHA COUNTY, MANSLAUGHTER, MEDIA MATTERS, MICHAEL BROWN, MISDEMEANOR ASSAULT, MISDEMEANOR ASSAULT AND RELATED OFFENSES, MISDEMEANOR SEX CRIMES, MOTHER JONES, MOVEON, MSNBC, MURDER, NBC NEWS, NEW YORK CITY, NEW YORK POLICE DEPARTMENT, NEWSWEEK, NON-NEGLIGENT MANSLAUGHTER, NPR, OAKLAND, PBS NEWSHOUR, PETIT LARCENY, POLITICO, POLITICUSUSA, PROACTIVE PROPERTY CRIMES, RAPE, RAW STORY, RESTRAINING ORDER, REUTERS, ROBBERY, ROBERT DALEY, RUSTEN SHESKEY, SALON, SAN FRANCISCO, SAN JOSE, SEATTLE TIMES, SEX CRIMES, SEXUAL ASSAULT, SHOOTINGS, SLATE, TALKING POINTS MEMO, TARGET BLUE: AN INSIDER'S VIEW OF THE NYPD (BOOK), THE ATLANTIC, THE CHICAGO SUN-TIMES, THE CHICAGO TRIBUNE, THE DAILY BEAST, THE DAILY BLOG, THE GUARDIAN, THE HILL, THE HUFFINGTON POST, THE LOS ANGELES TIMES, THE NATION, THE NEW REPUBLIC, THE NEW YORK TIMES, THE VILLAGE VOICE, THE WALL STREET JOURNAL, THE WASHINGTON POST, THINKPROGRESS, TIME, TRUTHDIG, TRUTHOUT, TWITTER, TWO POLITICAL JUNKIES, U.S. NEWS & WORLD REPORT, UPI, USA TODAY, WALNUT CREEK, WONKETTE
In Bureaucracy, History, Law, Law Enforcement, Politics, Social commentary on September 1, 2020 at 12:02 am
On August 23, Jason S. Blake, a 29-year-old black man, was shot and seriously injured by police in Kenosha, Wisconsin.
The shooting occurred as officers attempted to arrest him. Blake was tasered as he scuffled with police. When he opened the driver’s door to his SUV and leaned in, Officer Rusten Sheskey fired seven shots, striking him four times in the back.
Blake is now paralyzed from the waist down, and may never walk again.
Protests followed. Kenosha County declared a state of emergency overnight on August 24 after police vehicles were damaged, a dump truck set on fire, and the local courthouse vandalized. Police urged 24-hour businesses to close owing to armed robberies and shots being fired. Up to 200 members of the Wisconsin National Guard were deployed to maintain public safety.
Missing from the story—in most news media—has been one crucial fact:
At the time of the shooting, Blake faced a criminal complaint charging him with third-degree sexual assault in connection with domestic abuse on July 6.
The officers had come to arrest Blake for violating a restraining order stemming from that complaint. A 911 call on August 23 alerted them that Blake was at the home of his alleged victim.
A sample restraining order
The restraining order stemmed from a criminal complaint, which accused Blake of breaking into the home of a woman he knew and sexually assaulting her in May. The victim told police she was asleep when Blake broke in at 6 a.m. and said, “I want my shit.”
She told police that Blake used his finger to sexually assault her. She said the incident “caused her pain and humiliation and was done without her consent.”
After Blake left, she realized her keys were missing and “immediately called 911,” the complaint said.
An arrest warrant was issued on July 7.
On August 9, 2014, a similar police/media incident had occurred.
Michael Brown, an 18-year-old black man, was fatally shot by a white police officer named Darren Wilson in Ferguson, Missouri, a suburb of St. Louis.
Brown’s 22-year-old friend, Dorian Johnson claimed that Wilson shot him in the back. Wilson claimed he shot Brown after the latter charged at him.
An FBI investigation found that there was no evidence that Brown had his hands up in surrender or said “don’t shoot” before he was shot. It also found that Brown was struck six times, all in the front of his body.
The shooting ignited nationwide protests.
Yet many of the media “covering” the story refused to note that, shortly before his shooting, a video camera taped Brown robbing a grocery store and manhandling its owner.
Michael Brown (left) roughing up a store owner
Had this been more widely noted, “Saint Michael” would have been seen as a mere thug who learned that assaulting a cop wasn’t the same as attacking a store owner.
On May 25, George Floyd, a former black security guard, was murdered in Minneapolis, Minnesota. While Floyd was handcuffed and lying face down on a city street during an arrest, Derek Chauvin, a white Minneapolis police officer, kept his knee on the right side of Floyd’s neck for eight minutes and 46 seconds.
Death of George Floyd
Across the nation, cities were convulsed by protests—including those in the San Francisco Bay Area. Among these: Oakland, San Jose, Emeryville, Walnut Creek and San Francisco itself.
On May 30, an initially peaceful protest march exploded into looting shortly before 9 p.m. as looters broke off and began smashing shop windows and ransacking stores in Union Square and on Market Street.
Among stores looted: A Sak’s Off-Fifth Avenue, an Old Navy clothing store, a Cartier Boutique and a Coach store. Looters especially targeted CVS and Walgreens drugstores. Liquor stores and a BevMo were also hit.
“Thirty businesses were looted or destroyed,” said David Perry, from Union Square Business Improvement District.
Undoubtedly many of victims of those looters and arsonists had been horrified by the Floyd killing. But many of them undoubtedly lost sympathy for the Black Lives Matter movement as they surveyed the wreckage of their stores.
Store owners were infuriated at having to replace stock that had been stolen or destroyed. And employees resented having to clean up the wreckage. Some stores no doubt were forced to close, leaving their former employees suddenly jobless.
And President Donald Trump has quickly moved to capitalize on that resentment. His brand of “divide and rule” politics brought him to the White House in 2016. And he’s determined to play on white fears of further black crime to win a second term.
White fears of black crime are reflected in the crime rate statistics for New York City.
While Blacks make up 24.3% of New York City’s population, they comprise:
- 58.0% of its murder and non-negligent manslaughter arrests;
- 40.7% of its rape arrests;
- 34.6% of its known other felony sex crime arrests;
- 59.4% of its robbery arrests;
- 51.8% of its felonious assault arrests;
- 51.7% of its grand larceny arrests;
- 71.6% of its shooting arrests;
- 45.0% of its drug felony arrests;
- 48.5% of its drug misdemeanor arrests;
- 54.7% of its felony stolen property arrests;
- 45.9% of its misdemeanor stolen property arrests;
- 51.8% of its violent crime suspects;
- 60.0% of its juvenile crime complaint arrests.
This is admittedly unfair to those blacks who are law-abiding citizens. But the fear factor will continue until crime rates among blacks start falling dramatically.
2016 PRESIDENTIAL ELECTION, 2020 PRESIDENTIAL ELECTION, ABC NEWS, ALTERNET, AMERICABLOG, AP, ASSAULT, BABY BOOMER RESISTANCE, BLACK LIBERATION ARMY, BLACK LIVES MATTER, BLACKS, BLOOMBERG, BURGLARY, BUZZFEED, CBS NEWS, CNN, CRIME, CROOKS AND LIARS, DAILY KOZ, DARREN WILSON, DONALD TRUMP, DRUDGE REPORT, DRUGS, EMERYVILLE, FACEBOOK, FBI, FELONIOUS ASSAULT, FELONY SEX CRIMES, FERGUSON POLICE DEPARTMENT, FIVETHIRTYEIGHT, GEORGE FLOYD, GRAND LARCENY, HARPER’S MAGAZINE, HISPANICS, HUFFINGTON POST, JACOB BLAKEOB, JASON BLAKE, KENOSHA COUNTY, MANSLAUGHTER, MEDIA MATTERS, MICHAEL BROWN, MISDEMEANOR ASSAULT, MISDEMEANOR ASSAULT AND RELATED OFFENSES, MISDEMEANOR SEX CRIMES, MOTHER JONES, MOVEON, MSNBC, MURDER, NBC NEWS, NEW YORK CITY, NEW YORK POLICE DEPARTMENT, NEWSWEEK, NON-NEGLIGENT MANSLAUGHTER, NPR, OAKLAND, PBS NEWSHOUR, PETIT LARCENY, POLITICO, POLITICUSUSA, PROACTIVE PROPERTY CRIMES, RAPE, RAW STORY, RESTRAINING ORDER, REUTERS, ROBBERY, ROBERT DALEY, RUSTEN SHESKEY, SALON, SAN FRANCISCO, SAN JOSE, SEATTLE TIMES, SEX CRIMES, SEXUAL ASSAULT, SHOOTINGS, SLATE, TALKING POINTS MEMO, TARGET BLUE: AN INSIDER'S VIEW OF THE NYPD (BOOK), THE ATLANTIC, THE CHICAGO SUN-TIMES, THE CHICAGO TRIBUNE, THE DAILY BEAST, THE DAILY BLOG, THE GUARDIAN, THE HILL, THE HUFFINGTON POST, THE LOS ANGELES TIMES, THE NATION, THE NEW REPUBLIC, THE NEW YORK TIMES, THE VILLAGE VOICE, THE WALL STREET JOURNAL, THE WASHINGTON POST, THINKPROGRESS, TIME, TRUTHDIG, TRUTHOUT, TWITTER, TWO POLITICAL JUNKIES, U.S. NEWS & WORLD REPORT, UPI, USA TODAY, WALNUT CREEK, WONKETTE
In Bureaucracy, History, Law, Law Enforcement, Politics, Social commentary on August 31, 2020 at 12:22 am
Blacks make up 13% of the American population, according to the 2010 census of the United States.
But they committed 52% of homicides between 1980 and 2008, according to the Bureau of Justice Statistics. Only 45% of whites were offenders in such cases.
Blacks were disproportionately likely to commit homicide and to be the victims.
In 2008 blacks were seven times more likely than whites to commit homicide. And they were six times more likely than whites to be homicide victims.
According to the FBI, blacks were responsible for 38% of murders, compared to 31.1% for whites, in 2013.
From 2011 to 2013, 38.5% of people arrested for murder, manslaughter, rape, robbery, and aggravated assault were black.
In 1971, Robert Daley, a reporter for the New York Times, became a deputy police commissioner for the New York Police Department (NYPD).
In that capacity, he saw the NYPD from the highest levels to the lowest—from the ornate, awe-inspiring office of Police Commissioner Patrick Murphy to the gritty, sometimes blood-soaked streets of New York.
He spent one year on the job before resigning—later admitting that when he agreed to take the job, he got more than he bargained for.
It proved to be a tumultuous year in the NYPD’s history: Among those challenges Daley and his fellow NYPD members faced were the murders of several police officers, committed by members of the militant Black Liberation Army.
Two of those murdered officers were Waverly Jones and Joseph Piagentini. Jones was black, Piagentini white; both were partners. Both were shot in the back without a chance to defend themselves.
Writing about these murders in a bestselling 1973 book—Target Blue: An Insider’s View of the N.Y.P.D.—Daley noted:
- Jones and Piagentini were the sixth and seventh policemen—of ten—murdered in 1971.
- About 18 men were involved in these murders. All were black.
- The city’s politicians knew this—and so did Commissioner Murphy. None dared say so publicly.
“But the fact remained,” wrote Daley, “that approximately 65% of the city’s arrested murderers, muggers, armed robbers, proved to be black men; about 15% were of Hispanic origin; and about 20% were white [my Italics].”
The overall racial breakdown of the city was approximately:
- Whites, 63%;
- Blacks, 20%;
- Hispanics 17%.
Stated another way: Blacks, who made up 20% of the city’s population, were responsible for 65% of the city’s major crimes.
Or, as Daley himself put it: “So the dangerous precincts, any cop would tell you, were the black precincts.”
That was 49 years ago.
Now, consider the following statistics released by the NYPD for “Crime and Enforcement Activity in New York City” in 2019. Its introduction states:
“The reports below present statistics on race and ethnicity compiled from the New York City Police Department’s records management system.”
Then follows these statistics:
Murder and Non-Negligent Manslaughter Victims
- Black (56.6%)
- Hispanic (31.2%)
- White (4.9%)
- Asian/Pacific Islander (6.9%)
Murder and Non-Negligent Manslaughter Suspects
- Black (62.4%)
- Hispanic (30.8%)
- White (3.0%)
- Asian/Pacific Islander (3.8%)
Murder and Non-Negligent Manslaughter Arrestees
- Black 58.0%
- Hispanic 35.2%
- White 3.3%
- Asian/Pacific Islander 3.0%
Rape Victims
Rape Suspects
- Black 46.5%)
- Hispanic (34.8%)
- White (10.8%)
- Asian/Pacific Islander (7.3%)
Rape Arrestees
- Black (40.7%)
- Hispanic (45.4%
- )White (6.7%)
- Asian/Pacific Islander (7.0%)
NYPD Headquarters at One Police Plaza
Other Felony Sex Crimes Victims
- Black (33.8%)
- Hispanic (37.3%)
- White (21.3%)
- Asian/Pacific Islander (7.0%)
Other Felony Sex Crime Suspects
- Black (41.6%)
- Hispanic (37.5%)
- White (12.9%)
- Asian/Pacific Islander (7.3%)
Other Felony Sex Crime Arrestees
- Black (34.6%)
- Hispanic (47.4%)
- White (11.3%)
- Asian /Pacific Islander (6.4%)
Robbery Victims
Robbery Suspects
- Black (66.2%
- Hispanic (27.1%)
- White (4.3%)
- Asian/Pacific islander (2.3%)
Robbery Arrestees
- Black (59.4%)
- Hispanic (32.2%)
- White (5.2%)
- Asian/Pacific Islander (3.2%)
Misdemeanor Assault Victims
Misdemeanor Assault Suspects
Misdemeanor Assault Arrestees
Felonious Assault Victims
Felonious Assault Suspects
- Black (53.4%)
- Hispanic (32.6%)
- White (7.9%)
- Asian/Pacific Islanders (5.8%)
Felonious Assault Arrestees
- Black (51. 8%)
- Hispanic (33.1%)
- White (8.3%)
- Asian/Pacific Islanders (6.4%)
Grand Larceny Victims
- Black (24.4%)
- Hispanic (23.0%)
- White (35.9%)
- Asian/Pacific Islanders (15.7%)
Grand Larceny Suspects
- Black (50.5%)
- Hispanic (23.5%)
- White (11.7%)
- Asian/Pacific Islanders (3.9%)
Grand Larceny Arrestees
- Black (51.7%)
- Hispanic (28.5%)
- White (13.7%)
- Asian/Pacific Islanders (6.0%)
Firearm Arrest Population
Shooting Victims
Shooting Suspects
- Black (74.4%)
- Hispanic (22.0%)
- White (2.4%)
- Asian/Pacific Islander (1.1%)
Shooting Arrestees
- Black (71.6%)
- Hispanic (24.1%)
- White (2.7%)
- Asian/Pacific Islander (1.5%)
Drug Felony Arrest Population
- Black (45.0%)
- Hispanic (40.2%)
- White (9.7%)
- Asian Pacific Islanders (4.9%)
Drug Misdemeanor Arrestees
- Black (48.5%)
- Hispanic (35.3%)
- White (12.5%)
- Asian Pacific Islanders (3.6%)
Misdemeanor Sex Crime Victims
- Black (35.5%)
- Hispanic (36.7%)
- White (18.6%)
- Asian/Pacific Islanders (8.6%)
Misdemeanor Sex Crime Suspects
- Black (42.4%)
- Hispanic (34.2%)
- White (14.0%)
- Asian/Pacific Islanders (8.7%)
Misdemeanor Sex Crime Arrestees
- Black (52.5%)
- Hispanic (28.9%)
- White (14.5%)
- Asian/Pacific Islanders (4.0%)
Misdemeanor Stolen Property Arrest Population
- Black (45.9%)
- Hispanic (31.9%)
- White (16.8%)
- Asian/Pacific Islanders (5.1%)
Felony Stolen Property Arrest Population
- Black (54.7%)
- Hispanic (28.6%)
- White (11.5%)
- Asian/Pacific Islanders (5.0%)
Petit Larceny Victims
- Black (31.6%)
- Hispanic (29.9%)
- White (28.8%)
- Asian/Pacific Islanders (12.7%)
Petit Larceny Suspects
- Black (53.8%)
- Hispanic (26.8%)
- White (15.7%)
- Asian/Pacific Islanders (3.3%)
Petit Larceny Arrestees
- Black (44.7%)
- Hispanic (32.5%)
- White (17.9%)
- Asian/Pacific Islanders (3.3%)
Misdemeanor Criminal Mischief Victims
- Black (38.5%)
- Hispanic (29.8%)
- White (19.5%)
- Asian/Pacific Islanders (11.2%)
Misdemeanor Criminal Mischief Suspects
Misdemeanor Criminal Mischief Arrestees
Reported Crime Complaint Juvenile Victims
Juvenile Crime Complaint Suspects
Juvenile Arrest Population
ABC NEWS, ASSAULT, BLACK LIBERATION ARMY, BLACKS, BURGLARY, CBS NEWS, CNN, CRIME, DRUGS, FACEBOOK, GRAND LARCENY, HISPANICS, MANSLAUGHTER, MURDER, NBC NEWS, NEW YORK POLICE DEPARTMENT, RAPE, ROBBERY, ROBERT DALEY, SEX CRIMES, TARGET BLUE, THE CHICAGO SUN-TIMES, THE CHICAGO TRIBUNE, THE LOS ANGELES TIMES, THE NEW YORK TIMES, THE WALL STREET JOURNAL, THE WASHINGTON POST, TWITTER
In Bureaucracy, History, Law Enforcement, Social commentary on July 8, 2016 at 12:10 am
Blacks make up 13% of the American population, according to the 2010 census of the United States.
But they committed 52% of homicides between 1980 and 2008, according to the Bureau of Justice Statistics. Only 45% of whites were offenders in such cases.
Blacks were disproportionately likely to commit homicide and to be the victims. In 2008 blacks were seven times more likely than whites to commit homicide. And they were six times more likely than whites to be homicide victims.
According to the FBI, blacks were responsible for 38% of murders, compared to 31.1% for whites, in 2013.
From 2011 to 2013, 38.5% of people arrested for murder, manslaughter, rape, robbery, and aggravated assault were black.
Click here: FactCheck: do black Americans commit more crime?
In 1971, Robert Daley, a reporter for the New York Times, became a deputy police commissioner for the New York Police Department (NYPD).
In that capacity, he saw the NYPD from the highest levels to the lowest–from the ornate, awe-inspiring office of Police Commissioner Patrick Murphy to the gritty, sometimes blood-soaked streets of New York.
He spent one year on the job before resigning–later admitting that when he agreed to take the job, he got more than he bargained for.
It proved to be a tumultuous year in the NYPD’s history: Among those challenges Daley and his fellow NYPD members faced were the murders of several police officers, committed by members of the militant Black Liberation Army.
Two of those murdered officers were Waverly Jones and Joseph Piagentini. Jones was black, Piagentini white; both were partners. Both were shot in the back without a chance to defend themselves.
Writing about these murders in a bestselling 1973 book–Target Blue: An Inside’s View of the N.Y.P.D.–Daley noted:
- Jones and Piagentini were the sixth and seventh policemen–of ten–murdered in 1971.
- About 18 men were involved in these murders. All were black.
- The city’s politicians knew this–and so did Commissioner Murphy. None dared say so publicly.
“But the fact remained,” wrote Daley, “that approximately 65% of the city’s arrested murderers, muggers, armed robbers, proved to be black men; about 15% were of Hispanic origin; and about 20% were white [my Italics].”
The overall racial breakdown of the city was approximately:
- Whites, 63%;
- Blacks, 20%;
- Hispanics 17%.
Stated another way: Blacks, who made up 20% of the city’s population, were responsible for 65% of the city’s major crimes.
Or, as Daley himself put it: “So the dangerous precincts, any cop would tell you, were the black precincts.”
That was 43 years ago.
Now, consider the following statistics released by the NYPD for “Crime and Enforcement Activity in New York City” in 2012. Its introduction states:
“This report presents statistics on race/ethnicity compiled from the New York City Police Department’s records management system.”
Then follows this chart:
Misdemeanor Criminal Mischief
Victim, Suspect, Arrestee Race/Ethnicity
American Indians: Victims: 0.7% Suspects: 0.3% Arrestees: 0.3%
Asian/Pacific Islanders: Victims: 8.4% Suspects: 3.2% Arrestees: 3.9%
Blacks: Victims: 36.5% Suspects: 49.6% Arrestees: 36.5%
Whites: Victims: 28.9% Suspects: 17.0% Arrestees: 22.9%
Hispanics: Victims: 25.4% Suspects: 29.8% Arrestees: 36.4%
Total Victims: 40,985
Total Suspects: 11,356
Total Arrests: 7,825
Then come the guts of the report:
Murder and Non-Negligent Manslaughter Victims:
- Black (60.1)
- Hispanic (28.7%)
- White victims (872%)
- Asian/Pacific Islander (4.2%)
Murder and Non-Negligent Manslaughter Arrestees:
- Black (51.4%)
- Hispanic (36.7%)
- White (9.2%)
- Asian/Pacific Islander (2.6%)
Rape Victims:
Rape Arrestees:
Other Felony Sex Crimes Victims:
Known Other Felony Sex Crime Arrestees:
- Black (42.3%)
- Hispanic (39.8%)
- White (12.6%)
- Asian /Pacific Islander (5.1%)
Robbery Victims:
Robbery Arrestees:
- Black (62.1%)
- Hispanic (29.0%)
- White (6.2%)
- Asian/Pacific Islander (2.5%)
Felonious Assault Victims:
Felonious Assault Arrestees:
- Black (52.3%)
- Hispanic (33.6%)
- White (9.4%)
- Asian/Pacific Islanders (4.5%)
Grand Larceny Victims:
Grand Larceny Arrestees:
- Black (52.0%)
- Hispanic (28.5%)
- White (14.6%)
- Asian/Pacific Islanders (4.8%)
Shooting Victims:
Shooting Arrestees:
- Black (75.0%)
- Hispanic (22.0%)
- White (2.4%)
- Asian/Pacific Islander (0.6%)
Drug Felony Arrest Population:
- Black (45.3)
- Hispanic (40.0%)
- White (12.7%)
- Asian Pacific Islanders (1.9%)
The Drug Misdemeanor Arrest Population
- Black (49.9%)
- Hispanic (34.5%)
- White (13.3%)
- Asian Pacific Islanders (2.1%)
The Felony Stolen Property Arrest Population:
- Black (52.5%)
- Hispanic (28.9%)
- White (14.5%)
- Asian/Pacific Islanders (4.0%)
The Misdemeanor Stolen Property Arrest Population:
- Black (47.1%)
- Hispanic (30.2%)
- White (16.9%)
- Asian/Pacific Islanders (5.4%)
Violent Crime Suspects:
- Black (66.0%)
- Hispanic (26.1%)
- White (5.8%)
- Asian/Pacific Islanders (1.9%)
Reported Crime Complaint Juvenile Victims:
Juvenile Crime Complaint Arrestees:
- Black (58.6%)
- Hispanic (32.6%)
- White (5.8%)
- Asian/Pacific Islander (2.8%)
Appendix B of the report offers a breakdown of New York City’s racial makeup:
% of the City’s Population Total Numbers
- White 2,722,904 (33.3%)
- Black (22.8% 1,861,295
- Hispanic 2,336,076 (28.6%)
- Asian/Pacific Islanders 1,030,914 (12.6%)
Thus, while Blacks make up 22.8% of New York City’s population, they comprise
- 51.4% of its murder and non-negligent manslaughter arrests;
- 48.6% of its rape arrests;
- 42.3% of its known other felony sex crime arrests;
- 62.1% of its robbery arrests;
- 52.3% of its felonious assault arrests;
- 52.0% of its grand larceny arrests;
- 75.0% of its shooting arrests;
- 45.3% of its drug felony arrests;
- 49.9% of its drug misdemeanor arrests;
- 52.5% of its felony stolen property arrests;
- 47.1% of its misdemeanor stolen property arrests;
- 66.0% of its violent crime suspects;
- 58.6% of its juvenile crime complaint arrests.
Police, like most people, learn from their experiences. And if the majority of their experiences with blacks continue to be with the perpetrators of crime, they will continue to associate blacks as a whole with criminals.
This is admittedly unfair to those blacks who are not involved in any way with crime. But it will continue until crime rates among blacks start falling dramatically.
ABC NEWS, ASSAULT, BLACK LIBERATION ARMY, BLACKS, BURGLARY, CBS NEWS, CNN, CRIME, DRUGS, FACEBOOK, GRAND LARCENY, HISPANICS, MANSLAUGHTER, MURDER, NBC NEWS, NEW YORK POLICE DEPARTMENT, RAPE, ROBBERY, ROBERT DALEY, SEX CRIMES, TARGET BLUE, THE CHICAGO SUN-TIMES, THE CHICAGO TRIBUNE, THE LOS ANGELES TIMES, THE NEW YORK TIMES, THE WALL STREET JOURNAL, THE WASHINGTON POST, TWITTER, USA TODAY
In Bureaucracy, History, Law Enforcement, Social commentary on August 4, 2015 at 3:06 pm
Blacks make up 13% of the American population, according to the 2010 census of the United States.
But they committed 52% of homicides between 1980 and 2008, according to the Bureau of Justice Statistics. Only 45% of whites were offenders in such cases.
Blacks were disproportionately likely to commit homicide and to be the victims. In 2008 blacks were seven times more likely than whites to commit homicide. And they were six times more likely than whites to be homicide victims.
According to the FBI, blacks were responsible for 38% of murders, compared to 31.1% for whites, in 2013.
From 2011 to 2013, 38.5% of people arrested for murder, manslaughter, rape, robbery, and aggravated assault were black.
Click here: FactCheck: do black Americans commit more crime?
In 1971, Robert Daley, a reporter for the New York Times, became a deputy police commissioner for the New York Police Department (NYPD).
In that capacity, he saw the NYPD from the highest levels to the lowest–from the ornate, awe-inspiring office of Police Commissioner Patrick Murphy to the gritty, sometimes blood-soaked streets of New York.
He spent one year on the job before resigning–later admitting that when he agreed to take the job, he got more than he bargained for.
It proved to be a tumultuous year in the NYPD’s history: Among those challenges Daley and his fellow NYPD members faced were the murders of several police officers, committed by members of the militant Black Liberation Army.
Two of those murdered officers were Waverly Jones and Joseph Piagentini. Jones was black, Piagentini white; both were partners. Both were shot in the back without a chance to defend themselves.
Writing about these murders in a bestselling 1973 book–Target Blue: An Inside’s View of the N.Y.P.D.–Daley noted:
- Jones and Piagentini were the sixth and seventh policemen–of ten–murdered in 1971.
- About 18 men were involved in these murders. All were black.
- The city’s politicians knew this–and so did Commissioner Murphy. None dared say so publicly.
“But the fact remained,” wrote Daley, “that approximately 65% of the city’s arrested murderers, muggers, armed robbers, proved to be black men; about 15% were of Hispanic origin; and about 20% were white [my italics].”
The overall racial breakdown of the city was approximately:
- Whites, 63%;
- Blacks, 20%;
- Hispanics 17%.
Stated another way: Blacks, who made up 20% of the city’s population, were responsible for 65% of the city’s major crimes.
Or, as Daley himself put it: “So the dangerous precincts, any cop would tell you, were the black precincts.”
That was 42 years ago.
Now, consider the following statistics released by the NYPD for “Crime and Enforcement Activity in New York City” in 2012. Its introduction states:
“This report presents statistics on race/ethnicity compiled from the New York City Police Department’s records management system.”
Then come the guts of the report:
Murder and Non-Negligent Manslaughter Victims:
Murder and Non-Negligent Manslaughter Arrestees:
- Black (51.4%)
- Hispanic (36.7%)
- White (9.2%)
- Asian/Pacific Islander (2.6%)
Rape Victims:
Rape Arrestees:
- Black (48.6%)
- Hispanic (42.8%)
- White (5.0%)
- Asian/Pacific Islander (3.1%)
Other Felony Sex Crimes Victims:
Known Other Felony Sex Crime Arrestees:
- Black (42.3%)
- Hispanic (39.8%)
- White (12.6%)
- Asian /Pacific Islander (5.1%)
Robbery Victims:
Robbery Arrestees:
- Black (62.1%)
- Hispanic (29.0%)
- White (6.2%)
- Asian/Pacific Islander (2.5%)
Felonious Assault Victims:
Felonious Assault Arrestees:
- Black (52.3%)
- Hispanic (33.6%)
- White (9.4%)
- Asian/Pacific Islanders (4.5%)
Grand Larceny Victims:
Grand Larceny Arrestees:
- Black (52.0%)
- Hispanic (28.5%)
- White (14.6%)
- Asian/Pacific Islanders (4.8%)
Shooting Victims:
Shooting Arrestees:
- Black (75.0%)
- Hispanic (22.0%)
- White (2.4%)
- Asian/Pacific Islander (0.6%)
Drug Felony Arrest Population:
- Black (45.3%)
- Hispanic (40.0%)
- White (12.7%)
- Asian Pacific Islanders (1.9%)
The Drug Misdemeanor Arrest Population
- Black (49.9%)
- Hispanic (34.5%)
- White (13.3%)
- Asian Pacific Islanders (2.1%)
The Felony Stolen Property Arrest Population:
- Black (52.5%)
- Hispanic (28.9%)
- White (14.5%)
- Asian/Pacific Islanders (4.0%)
The Misdemeanor Stolen Property Arrest Population:
- Black (47.1%)
- Hispanic (30.2%)
- White (16.9%)
- Asian/Pacific Islanders (5.4%)
Violent Crime Suspects:
- Black (66.0%)
- Hispanic (26.1%)
- White (5.8%)
- Asian/Pacific Islanders (1.9%)
Reported Crime Complaint Juvenile Victims:
Juvenile Crime Complaint Arrestees:
- Black (58.6%)
- Hispanic (32.6%)
- White (5.8%)
- Asian/Pacific Islander (2.8%)
Appendix B of the report offers a breakdown of New York City’s racial makeup:
Total Numbers % the City’s Population
- White 2,722,904 (33.3%)
- Black 1,861,295 (22.8%)
- Hispanic 2,336,076 (28.6%)
- Asian/Pacific Islanders 1,030,914 (12.6%)
Thus, while Blacks make up 22.8% of New York City’s population, they comprise
- 51.4% of its murder and non-negligent manslaughter arrests;
- 48.6% of its rape arrests;
- 42.3% of its known other felony sex crime arrests;
- 62.1% of its robbery arrests;
- 52.3% of its felonious assault arrests;
- 52.0% of its grand larceny arrests;
- 75.0% of its shooting arrests;
- 45.3% of its drug felony arrests;
- 49.9% of its drug misdemeanor arrests;
- 52.5% of its felony stolen property arrests;
- 47.1% of its misdemeanor stolen property arrests;
- 66.0% of its violent crime suspects;
- 58.6% of its juvenile crime complaint arrests.
Police, like most people, learn from their experiences. And if the majority of their experiences with blacks continue to be with the perpetrators of crime, they will continue to associate blacks as a whole with criminals.
This is admittedly unfair to those blacks who are not involved in any way with crime. But it will continue until crime rates among blacks start falling dramatically.
ABC NEWS, ASSAULT, BLACK LIBERATION ARMY, BLACKS, BURGLARY, CBS NEWS, CNN, CRIME, DRUGS, FACEBOOK, GRAND LARCENY, HISPANICS, MANSLAUGHTER, MURDER, NBC NEWS, NEW YORK POLICE DEPARTMENT, RAPE, ROBBERY, ROBERT DALEY, SEX CRIMES, TARGET BLUE, THE CHICAGO SUN-TIMES, THE CHICAGO TRIBUNE, THE LOS ANGELES TIMES, THE NEW YORK TIMES, THE WALL STREET JOURNAL, THE WASHINGTON POST, TWITTER
In Bureaucracy, History, Law Enforcement, Politics, Social commentary on May 13, 2015 at 1:25 pm
Blacks make up 13% of the American population, according to the 2010 census of the United States.
But they committed 52% of homicides between 1980 and 2008, according to the Bureau of Justice Statistics. Only 45% of whites were offenders in such cases.
Blacks were disproportionately likely to commit homicide and to be the victims. In 2008 blacks were seven times more likely than whites to commit homicide. And they were six times more likely than whites to be homicide victims.
According to the FBI, blacks were responsible for 38% of murders, compared to 31.1% for whites, in 2013.
From 2011 to 2013, 38.5% of people arrested for murder, manslaughter, rape, robbery, and aggravated assault were black.
Click here: FactCheck: do black Americans commit more crime?
In 1971, Robert Daley, a reporter for the New York Times, became a deputy police commissioner for the New York Police Department (NYPD).
In that capacity, he saw the NYPD from the highest levels to the lowest–from the ornate, awe-inspiring office of Police Commissioner Patrick Murphy to the gritty, sometimes blood-soaked streets of New York.
He spent one year on the job before resigning–later admitting that when he agreed to take the job, he got more than he bargained for.
It proved to be a tumultuous year in the NY’D’s history: Among those challenges Daley and his fellow NYPD members faced were the murders of several police officers, committed by members of the militant Black Liberation Army.
Two of those murdered officers were Waverly Jones and Joseph Piagentini. Jones was black, Piagentini white; both were partners. Both were shot in the back without a chance to defend themselves.
Writing about these murders in a bestselling 1973 book–Target Blue: An Inside’s View of the N.Y.P.D.–Daley noted:
- Jones and Piagentini were the sixth and seventh policemen–of ten–murdered in 1971.
- About 18 men were involved in these murders. All were black.
- The city’s politicians knew this–and so did Commissioner Murphy. None dared say so publicly.
“But the fact remained,” wrote Daley, “that approximately 65% of the city’s arrested murderers, muggers, armed robbers, proved to be black men; about 15% were of Hispanic origin; and about 20% were white [my italics].
The overall racial breakdown of the city was approximately:
- Whites, 63%;
- Blacks, 20%;
- Hispanics 17%.
Stated another way: Blacks, who made up 20% of the city’s population, were responsible for 65% of the city’s major crimes.
Or, as Daley himself put it: “So the dangerous precincts, any cop would tell you, were the black precincts.”
That was 42 years ago.
Now, consider the following statistics released by the NYPD for “Crime and Enforcement Activity in New York City” in 2012. Its introduction states:
“This report presents statistics on race/ethnicity compiled from the New York City Police Department’s records management system.”
Then follows this chart:
Misdeanor Criminal Mischief
Victim, Suspect, Arrestee Race/Ethnicity
American Indians: Victims: 0.7% Suspects: 0.3% Arrestees: 0.3%
Asian/Pacific Islanders: Victims: 8.4% Suspects: 3.2% Arrestees: 3.9%
Blacks: Victims: 36.5% Suspects: 49.6% Arrestees: 36.5%
Whites: Victims: 28.9% Suspects: 17.0% Arrestees: 22.9%
Hispanics: Victims: 25.4% Suspects: 29.8% Arrestees: 36.4%
Total Victims: 40,985
Total Suspects: 11,356
Total Arrests: 7,825
Then come the guts of the report:
Murder and Non-Negligent Manslaughter Victims:
Murder and Non-Negligent Manslaughter Arrestees:
- Black (51.4%)
- Hispanic (36.7%)
- White (9.2%)
- Asian/Pacific Islander (2.6%)
Rape Victims:
Rape Arrestees:
- Black (48.6%)
- Hispanic (42.8%)
- White (5.0%)
- Asian/Pacific Islander (3.1%)
Other Felony Sex Crimes Victims:
Known Other Felony Sex Crime Arrestees:
- Black (42.3%)
- Hispanic (39.8%)
- White (12.6%)
- Asian /Pacific Islander (5.1%)
Robbery Victims:
Robbery Arrestees:
- Black (62.1%)
- Hispanic (29.0%)
- White (6.2%)
- Asian/Pacific Islander (2.5%)
Felonious Assault Victims:
Felonious Assault Arrestees:
- Black (52.3%)
- Hispanic (33.6%)
- White (9.4%)
- Asian/Pacific Islanders (4.5%)
Grand Larceny Victims:
Grand Larceny Arrestees:
- Black (52.0%)
- Hispanic (28.5%)
- White (14.6%)
- Asian/Pacific Islanders (4.8%)
Shooting Victims:
Shooting Arrestees:
- Black (75.0%)
- Hispanic (22.0%)
- White (2.4%)
- Asian/Pacific Islander (0.6%)
Drug Felony Arrest Population:
- Black (45.3%)
- Hispanic (40.0%)
- White (12.7%)
- Asian Pacific Islanders (1.9%)
The Drug Misdemeanor Arrest Population
- Black (49.9%)
- Hispanic (34.5%)
- White (13.3%)
- Asian Pacific Islanders (2.1%)
The Felony Stolen Property Arrest Population:
- Black (52.5%)
- Hispanic (28.9%)
- White (14.5%)
- Asian/Pacific Islanders (4.0%)
The Misdemeanor Stolen Property Arrest Population:
- Black (47.1%)
- Hispanic (30.2%)
- White (16.9%)
- Asian/Pacific Islanders (5.4%)
Violent Crime Suspects:
- Black (66.0%)
- Hispanic (26.1%)
- White (5.8%)
- Asian/Pacific Islanders (1.9%)
Reported Crime Complaint Juvenile Victims:
Juvenile Crime Complaint Arrestees:
- Black (58.6%)
- Hispanic (32.6%)
- White (5.8%)
- Asian/Pacific Islander (2.8%)
Appendix B of the report offers a breakdown of New York City’s racial makeup:
Total Numbers % the City’s Population
- White 2,722,904 (33.3%)
- Black 1,861,295 (22.8%)
- Hispanic 2,336,076 (28.6%)
- Asian/Pacific Islanders 1,030,914 (12.6%)
Thus, while Blacks make up 22.8% of New York City’s population, they comprise
- 51.4% of its murder and non-negligent manslaughter arrests;
- 48.6% of its rape arrests;
- 42.3% of its known other felony sex crime arrests;
- 62.1% of its robbery arrests;
- 52.3% of its felonious assault arrests;
- 52.0% of its grand larceny arrests;
- 75.0% of its shooting arrests;
- 45.3% of its drug felony arrests;
- 49.9% of its drug misdemeanor arrests;
- 52.5% of its felony stolen property arrests;
- 47.1% of its misdemeanor stolen property arrests;
- 66.0% of its violent crime suspects;
- 58.6% of its juvenile crime complaint arrests.
Police, like most people, learn from their experiences. And if the majority of their experiences with blacks continue to be with the perpetrators of crime, they will continue to associate blacks as a whole with criminals.
This is admittedly unfair to those blacks who are not involved in any way with crime. But it will continue until crime rates among blacks start falling dramatically.
ABC NEWS, ASSAULT, BLACK LIBERATION ARMY, BLACKS, BURGLARY, CBS NEWS, CNN, CRIME, DRUGS, FACEBOOK, GRANDLARCENY, HISPANICS, MANSLAUGHTER, MURDER, NBC NEWS, NEW YORK POLICE DEPARTMENT, RAPE, ROBBERY, ROBERT DALEY, SEX CRIMES, TARGET BLUE, THE CHICAGO SUN-TIMES, THE CHICAGO TRIBUNE, THE LOS ANGELES TIMES, THE NEW YORK TIMES, THE WALL STREET JOURNAL, THE WASHINGTON POST, TWITTER
In Bureaucracy, History, Law, Law Enforcement, Politics, Social commentary on December 8, 2014 at 12:00 am
Are some races more prone to crime–and especially violence–than others?
It remains a hotly-debated topic. But while the origins of crime remain debatable, the races of its perpetrators and victims can be–and have been–statistically tabulated.
And those statistics haven’t changed much during the last 40 years.
Consider this:
In 1971, Robert Daley, a reporter for the New York Times, became a deputy police commissioner for the New York Police Department (NYPD).
In that capacity, he saw the NYPD from the highest levels to the lowest–from the ornate, awe-inspiring office of Police Commissioner Patrick Murphy to the gritty, sometimes blood-soaked streets of New York.
He spent one year on the job before resigning–later admitting that when he agreed to take the job, he got more than he bargained for.
It proved to be a tumultuous year in the NY’D’s history: Among those challenges Daley and his fellow NYPD members faced were the murders of several police officers, committed by members of the militant Black Liberation Army.
Two of those murdered officers were Waverly Jones and Joseph Piagentini. Jones was black, Piagentini white; both were partners. Both were shot in the back without a chance to defend themselves.
Writing about these murders in a bestselling 1973 book–Target Blue: An Inside’s View of the N.Y.P.D.–Daley noted:
- Jones and Piagentini were the sixth and seventh policemen–of ten–murdered in 1971.
- About 18 men were involved in these murders. All were black.
- The city’s politicians knew this–and so did Commissioner Murphy. None dared say so publicly.
“But the fact remained,” wrote Daley, “that approximately 65% of the city’s arrested murderers, muggers, armed robbers, proved to be black men; about 15% were of Hispanic origin; and about 20% were white [my italics].
The overall racial breakdown of the city was approximately:
- Whites, 63%;
- Blacks, 20%;
- Hispanics 17%.
Stated another way: Blacks, who made up 20% of the city’s population, were responsible for 65% of the city’s major crimes.
Or, as Daley himself put it: “So the dangerous precincts, any cop would tell you, were the black precincts.”
That was 42 years ago.
Now, consider the following statistics released by the NYPD for “Crime and Enforcement Activity in New York City” in 2012. Its introduction states:
“This report presents statistics on race/ethnicity compiled from the New York City Police Department’s records management system.”
Then follows this chart:
Misdeanor Criminal Mischief
Victim, Suspect, Arrestee Race/Ethnicity
American Indians: Victims: 0.7% Suspects: 0.3% Arrestees: 0.3%
Asian/Pacific Islanders: Victims: 8.4% Suspects: 3.2% Arrestees: 3.9%
Blacks: Victims: 36.5% Suspects: 49.6% Arrestees: 36.5%
Whites: Victims: 28.9% Suspects: 17.0% Arrestees: 22.9%
Hispanics: Victims: 25.4% Suspects: 29.8% Arrestees: 36.4%
Total Victims: 40,985
Total Suspects: 11,356
Total Arrests: 7,825
Then come the guts of the report:
Murder and Non-Negligent Manslaughter Victims:
Murder and Non-Negligent Manslaughter Arrestees:
- Black (51.4%)
- Hispanic (36.7%)
- White (9.2%)
- Asian/Pacific Islander (2.6%)
Rape Victims:
Rape Arrestees:
- Black (48.6%)
- Hispanic (42.8%)
- White (5.0%)
- Asian/Pacific Islander (3.1%)
Other Felony Sex Crimes Victims:
Known Other Felony Sex Crime Arrestees:
- Black (42.3%)
- Hispanic (39.8%)
- White (12.6%)
- Asian /Pacific Islander (5.1%)
Robbery Victims:
Robbery Arrestees:
- Black (62.1%)
- Hispanic (29.0%)
- White (6.2%)
- Asian/Pacific Islander (2.5%)
Felonious Assault Victims:
Felonious Assault Arrestees:
- Black (52.3%)
- Hispanic (33.6%)
- White (9.4%)
- Asian/Pacific Islanders (4.5%)
Grand Larceny Victims:
Grand Larceny Arrestees:
- Black (52.0%)
- Hispanic (28.5%)
- White (14.6%)
- Asian/Pacific Islanders (4.8%)
Shooting Victims:
Shooting Arrestees:
- Black (75.0%)
- Hispanic (22.0%)
- White (2.4%)
- Asian/Pacific Islander (0.6%)
Drug Felony Arrest Population:
- Black (45.3%)
- Hispanic (40.0%)
- White (12.7%)
- Asian Pacific Islanders (1.9%)
The Drug Misdemeanor Arrest Population
- Black (49.9%)
- Hispanic (34.5%)
- White (13.3%)
- Asian Pacific Islanders (2.1%)
The Felony Stolen Property Arrest Population:
- Black (52.5%)
- Hispanic (28.9%)
- White (14.5%)
- Asian/Pacific Islanders (4.0%)
The Misdemeanor Stolen Property Arrest Population:
- Black (47.1%)
- Hispanic (30.2%)
- White (16.9%)
- Asian/Pacific Islanders (5.4%)
Violent Crime Suspects:
- Black (66.0%)
- Hispanic (26.1%)
- White (5.8%)
- Asian/Pacific Islanders (1.9%)
Reported Crime Complaint Juvenile Victims:
Juvenile Crime Complaint Arrestees:
- Black (58.6%)
- Hispanic (32.6%)
- White (5.8%)
- Asian/Pacific Islander (2.8%)
Appendix B of the report offers a breakdown of New York City’s racial makeup:
Total Numbers % the City’s Population
- White 2,722,904 (33.3%)
- Black 1,861,295 (22.8%)
- Hispanic 2,336,076 (28.6%)
- Asian/Pacific Islanders 1,030,914 (12.6%)
Thus, while Blacks make up 22.8% of New York City’s population, they comprise
- 51.4% of its murder and non-negligent manslaughter arrests;
- 48.6% of its rape arrests;
- 42.3% of its known other felony sex crime arrests;
- 62.1% of its robbery arrests;
- 52.3% of its felonious assault arrests;
- 52.0% of its grand larceny arrests;
- 75.0% of its shooting arrests;
- 45.3% of its drug felony arrests;
- 49.9% of its drug misdemeanor arrests;
- 52.5% of its felony stolen property arrests;
- 47.1% of its misdemeanor stolen property arrests;
- 66.0% of its violent crime suspects;
- 58.6% of its juvenile crime complaint arrests.
While Hispanics make up 28.6% of the city’s population, they account for:
- 36.7% of its murder and non-negligent manslaughter arrests;
- 42.8% of its rape arrests;
- 39.8% for its known other felony sex crime arrests;
- 29.0% of its robbery arrests;
- 33.6% of its felonious assault arrests;
- 28.5% of its grand larceny arrests;
- 22.0% of its shooting arrests;
- 40.0% of its drug felony arrests;
- 34.5% of its drug misdemeanor arrests;
- 28.9% of its felony stolen property arrests;
- 30.2% of its misdemeanor stolen property arrests;
- 26.1% of its violent crime suspects;
- 26.1% of its juvenile crime complaint arrests.
In short:
During the first six months of 2012, 96% of shooting victims were blacks or Hispanics–and in 97% of all cases, the shooters were other blacks or Hispanics.
Blacks and Hispanics comprise 89% of murder victims–and 86% of murder suspects. Of felony assault victims, 81% are non-whites, as are 88% of the suspects.

2016 PRESIDENTIAL ELECTION, 2020 PRESIDENTIAL ELECTION, ABC NEWS, ALTERNET, AMERICABLOG, AP, ASSAULT, BABY BOOMER RESISTANCE, BLACK LIBERATION ARMY, BLACK LIVES MATTER, BLACKS, BLOOMBERG, BURGLARY, BUZZFEED, CBS NEWS, CNN, CRIME, CROOKS AND LIARS, DAILY KOZ, DARREN WILSON, DONALD TRUMP, DRUDGE REPORT, DRUGS, EMERYVILLE, FBI, FELONIOUS ASSAULT, FELONY SEX CRIMES, FERGUSON POLICE DEPARTMENT, FIVETHIRTYEIGHT, GEORGE FLOYD, GRAND LARCENY, HARPER’S MAGAZINE, HISPANICS, HUFFINGTON POST, JASON BLAKE, JESSE JACKSON, KENOSHA COUNTY, MANSLAUGHTER, MARTIN LUTHER KING, MEDIA MATTERS, MICHAEL BROWN, MISDEMEANOR ASSAULT, MISDEMEANOR ASSAULT AND RELATED OFFENSES, MISDEMEANOR SEX CRIMES, MOTHER JONES, MOVEON, MSNBC, MURDER, NBC NEWS, NEW YORK CITY, NEW YORK POLICE DEPARTMENT, NEWSWEEK, NON-NEGLIGENT MANSLAUGHTER, NPR, OAKLAND, PBS NEWSHOUR, PETIT LARCENY, POLITICO, POLITICUSUSA, PROACTIVE PROPERTY CRIMES, RAPE, RAW STORY, RESTRAINING ORDER, REUTERS, ROBBERY, ROBERT DALEY, RUSTEN SHESKEY, SALON, SAN FRANCISCO, SAN JOSE, SEATTLE TIMES, SEX CRIMES, SEXUAL ASSAULT, SHOOTINGS, SLATE, TALKING POINTS MEMO, TARGET BLUE: AN INSIDER'S VIEW OF THE NYPD (BOOK), THE ATLANTIC, THE CHICAGO SUN-TIMES, THE CHICAGO TRIBUNE, THE DAILY BEAST, THE DAILY BLOG, THE GUARDIAN, THE HILL, THE HUFFINGTON POST, THE LOS ANGELES TIMES, THE NATION, THE NEW REPUBLIC, THE NEW YORK TIMES, THE VILLAGE VOICE, THE WALL STREET JOURNAL, THE WASHINGTON POST, THINKPROGRESS, TIME, TRUTHDIG, TRUTHOUT, TWITTER, TWO POLITICAL JUNKIES, U.S. NEWS & WORLD REPORT, UPI, USA TODAY, WALNUT CREEK, WONKETTE
RIDING THE BLACK CRIME WAVE: PART TWO (END)
In Bureaucracy, History, Law, Law Enforcement, Politics, Social commentary on October 12, 2023 at 12:10 amOn August 23, 2021, Jacob S. Blake, a 29-year-old black man, was shot and seriously injured by police in Kenosha, Wisconsin.
The shooting occurred as officers attempted to arrest him. Blake was tasered as he scuffled with police. When he opened the driver’s door to his SUV and leaned in, Officer Rusten Sheskey fired seven shots, striking him four times in the back.
Blake is now paralyzed from the waist down, and may never walk again.
Protests followed.
Kenosha County declared a state of emergency overnight on August 24 after police vehicles were damaged, a dump truck set on fire, and the local courthouse vandalized. Police urged 24-hour businesses to close owing to armed robberies and shots being fired. Up to 200 members of the Wisconsin National Guard were deployed to maintain public safety.
At the time of the shooting, Blake faced a criminal complaint charging him with third-degree sexual assault in connection with domestic abuse on July 6.
The officers had come to arrest Blake for violating a restraining order stemming from that complaint. A 911 call on August 23 alerted them that Blake was at the home of his alleged victim.
A sample restraining order
The restraining order stemmed from a criminal complaint, which accused Blake of breaking into the home of a woman he knew and sexually assaulting her in May. The victim told police she was asleep when Blake broke in at 6 a.m. and said, “I want my shit.”
After Blake left, she realized her keys were missing and “immediately called 911,” the complaint said.
An arrest warrant was issued on July 7.
On August 9, 2014, a similar police/media incident had occurred.
Michael Brown, an 18-year-old black man, was fatally shot by a white police officer named Darren Wilson in Ferguson, Missouri, a suburb of St. Louis.
Brown’s 22-year-old friend, Dorian Johnson claimed that Wilson shot him in the back. Wilson claimed he shot Brown after the latter charged at him.
An FBI investigation found that there was no evidence that Brown had his hands up in surrender or said “don’t shoot” before he was shot. It also found that Brown was struck six times, all in the front of his body.
The shooting ignited nationwide protests.
Yet many of the media “covering” the story refused to note that, shortly before his shooting, a video camera taped Brown robbing a grocery store and manhandling its owner.
Michael Brown (left) roughing up a store owner
Had this been more widely noted, “Saint Michael” would have been seen as a mere thug who learned that assaulting an armed cop wasn’t the same as attacking an unarmed store owner.
On May 25, 2020, George Floyd, a former black security guard, was murdered in Minneapolis, Minnesota. While Floyd was handcuffed and lying face down on a city street during an arrest, Derek Chauvin, a white Minneapolis police officer, kept his knee on the right side of Floyd’s neck for eight minutes and 46 seconds.
Death of George Floyd
Across the nation, cities were convulsed by protests—including those in the San Francisco Bay Area. Among these: Oakland, San Jose, Emeryville, Walnut Creek and San Francisco itself.
On May 30, an initially peaceful protest march exploded into looting shortly before 9 p.m. as looters broke off and began smashing shop windows and ransacking stores in Union Square and on Market Street.
Among the stores looted: A Sak’s Off-Fifth Avenue, an Old Navy clothing store, a Cartier Boutique and a Coach store. Looters especially targeted CVS and Walgreens drugstores. Liquor stores and a BevMo were also hit.
“Thirty businesses were looted or destroyed,” said David Perry, from the Union Square Business Improvement District.
Undoubtedly many of victims of those looters and arsonists had been horrified by the Floyd killing. But many of them undoubtedly lost sympathy for the Black Lives Matter movement as they surveyed the wreckage of their stores.
Store owners were infuriated at having to replace stock that had been stolen or destroyed. And employees resented having to clean up the wreckage. Some stores no doubt were forced to close, leaving their former employees suddenly jobless.
And President Donald Trump quickly moved to capitalize on that resentment. His brand of “divide and rule” politics had brought him to the White House in 2016. And he was determined to play on white fears of further black crime to win a second term.
White fears of black crime are reflected in the crime rate statistics for New York City.
While Blacks make up 14.2% of New York City’s population, they comprise:
This is admittedly unfair to those blacks who are law-abiding citizens. But the fear factor will continue until crime rates among blacks start falling dramatically.
Share this: